
BSL_SSL_Liqudity
مؤشر
7 عمليات الشراء
الإصدار 1.0، Aug 2025
Windows, Mac
4.3
التقييمات: 3
الوصف
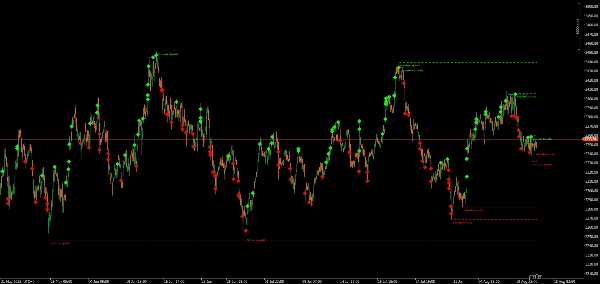
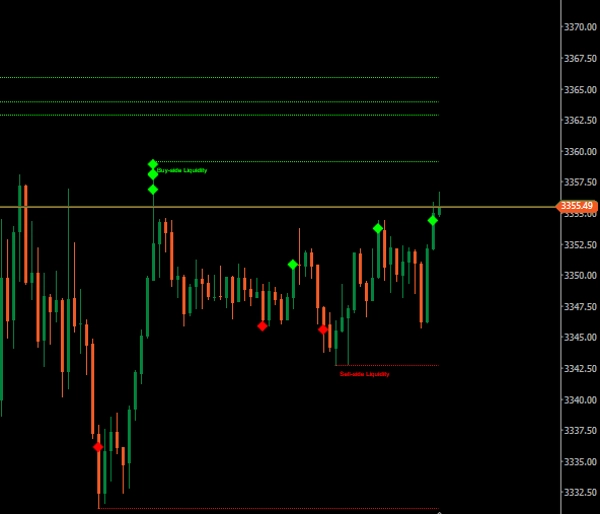
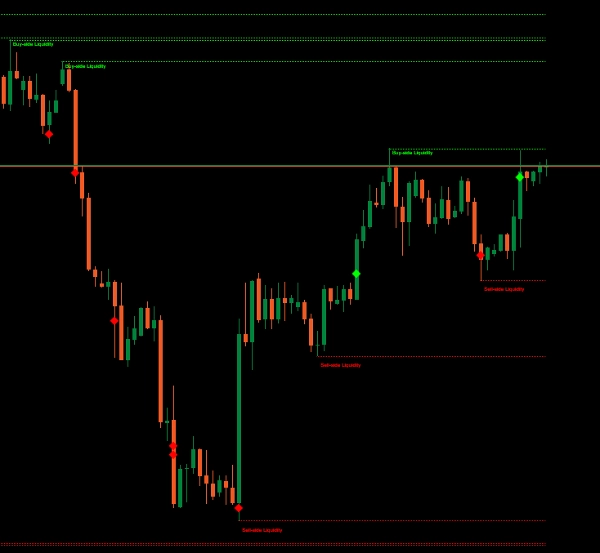
مؤشر السيولة من جانب الشراء والبيع (BSL/SSL) مصمم للمتداولين الذين يتبعون استراتيجيات (ICT) أو القائمة على السيولة. يقوم تلقائيًا بالكشف عن مناطق السيولة الرئيسية في السوق—مبرزًا قمم التأرجح (سيولة جانب الشراء) وقيعان التأرجح (سيولة جانب البيع)—ويراقب ما إذا كانت هذه المستويات قد تم اجتيازها أو لا تزال سليمة.
- BSL (سيولة جانب الشراء) – يحدد قمم التأرجح الأخيرة حيث قد تتجمع أوامر وقف الخسارة من المراكز القصيرة أو أوامر الشراء عند الاختراق.
- SSL (سيولة جانب البيع) – يحدد قيعان التأرجح الأخيرة حيث قد تكون أوامر وقف الخسارة من المراكز الطويلة أو أوامر البيع عند الاختراق موجودة.
- علامات الاجتياز – عندما يخترق السعر مستوى السيولة المحدد، يرسم المؤشر علامة ماسية لإظهار الاجتياز.
لمن هو هذا؟
- متداولو منهجية ICT
- استراتيجيون الاستحواذ على السيولة / مطاردة وقف الخسارة
- المتداولون السريعون ومتداولو اليوم الذين يستهدفون تحركات الجلسة
- متداولو التأرجح الباحثون عن نقاط انعكاس ذات احتمالية عالية
الفوائد
- وضوح بصري – رؤية فورية لأماكن احتمال بحث السوق عن السيولة.
- كفاءة الوقت – لا حاجة بعد الآن لوضع علامات التأرجحات يدويًا والتحقق من الاجتيازات.
- ميزة استراتيجية – الجمع مع
- FVGs،
- هيكل السوق لتحسين إعدادات التداول.
- مناطق قتل الجلسة
- الماكروز
منتجاتي الأخرى
- مناطق FVG المؤسسية متعددة الأطر الزمنية مع التقاء
- مجموعة مستويات الجلسة الشاملة
- MARKET_STRUCTURE BOS_CHoCH
- تراكب مخطط الشمعدان متعدد الأطر الزمنية
- مناطق قتل ICT والماكروز
- ICT_SMC_ToolKit
- VWAP_MTF
- مؤشر المتداولين الديناميكي (TDI)
- جلسة السوق الفوركس
إخلاء المسؤولية: التداول ينطوي على مخاطر، والنتائج السابقة لا تضمن الأداء المستقبلي. استخدم إدارة المخاطر المناسبة، واتبع مستويات وقف الخسارة، وتداول بمسؤولية. لست مسؤولًا عن أي خسائر مالية ناتجة عن استخدام هذه الخوارزميات. استخدم هذه المؤشرات لتقوية تحليلك وتقليل وقت وضع العلامات على المخطط الخاص بك.
الملخص
ملخص الذكاء الاصطناعي
The Buy-Side & Sell-Side Liquidity (BSL/SSL) Indicator identifies key liquidity zones in the market by marking recent swing highs (Buy-Side Liquidity) and swing lows (Sell-Side Liquidity). It highlights areas where stop-loss orders or breakout orders may cluster and tracks whether these liquidity levels have been breached, displaying diamond markers to indicate sweeps. Designed for traders using ICT methodology, liquidity grab, or stop hunt strategies, it supports scalpers, day traders, and swing traders targeting session-based moves or high-probability reversal points. The indicator provides visual clarity by automatically marking liquidity zones, saving time otherwise spent manually identifying swings and sweeps. It can be combined with other tools such as Fair Value Gaps (FVGs), market structure analysis, and session kill zones to refine trade setups. Supported markets include Forex, indices, commodities, and popular symbols like BTCUSD, EURUSD, XAUUSD, and NAS100. The indicator aims to enhance strategic decision-making by clearly displaying where the market is likely to seek liquidity.
ملف تعريف المؤشر
تقييمات العملاء
4.3
التقييمات: 3
5 | 33 % | |
4 | 67 % | |
3 | 0 % | |
2 | 0 % | |
1 | 0 % |
تقييمات العملاء
August 16, 2025
Practical account helper around smart money style analysis. The useful part is mapping zones before entries, with the numbers checked before scaling. A good sample is 20 FVG or order block reactions, with messy 0.705 areas skipped. The zone is more convincing when structure and risk both make sense.
August 15, 2025
August 15, 2025
Clean trading note if the trader wants it adds structure around liquidity, gaps and market shifts. It works best as support, not a final decision maker. For SMC logic, I trust zones more when 0.5 mitigation, BOS and liquidity sweep line up. zones still need manual validation.
مناقشة
الأسئلة الشائعة
BTCUSD
Forex
Indices
EURUSD
Commodities
XAUUSD
NAS100
يتم توفير المنتجات المتاحة من خلال cTrader Store، بما في ذلك روبوتات التداول والمؤشرات والإضافات، من قبل مطوري الطرف الثالث وإتاحتها لأغراض الوصول المعلوماتي والفني فقط. cTrader Store ليس وسيطًا ولا يقدم نصائح استثمارية أو توصيات شخصية أو أي ضمان للأداء المستقبلي.


السعر
منذ 22/06/2025
80
المبيعات
84
التثبيتات المجانية