
Half Trend BT
مؤشر
38 عمليات الشراء
الإصدار 1.0، Mar 2025
Windows, Mac
4.3
التقييمات: 3
الوصف
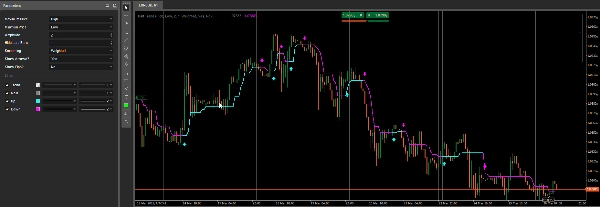
مؤشر Half Trend مصمم لاكتشاف وتسليط الضوء على احتمالات انعكاسات الاتجاه من خلال مقارنة القمم والقيعان الأخيرة خلال فترة محددة، ثم رسم خط "صاعد" أو "هابط" وفقًا لذلك. يرسم الأسهم اختياريًا عند كل تغيير في الاتجاه ويمكنه عرض فروق النقاط بين الإشارات.
- اختيار سلسلة القمم/القيعان
- يستخدم المؤشر سلسلتين من الأسعار (القمم والقيعان بشكل افتراضي) لتتبع القمم والقيعان المحلية.
- يمكنك اختيار أنواع أسعار مختلفة (مثل
Open،Close،Median، إلخ) لكل سلسلة عبر Maximum Price و Minimum Price.
- المتوسطات المتحركة وحساب الفترة
- يتم تطبيق متوسط متحرك (استنادًا إلى نوع Smoothing المختار وفترة Amplitude) على كل من سلسلتي السعر "المرتفع" و"المنخفض" المختارتين.
- يقارن المؤشر أسعار الشمعة الحالية مع هذه المستويات الملساء للقمم/القيعان ليقرر ما إذا كان يجب التحول من اتجاه صاعد إلى هابط (أو العكس).
- كشف الاتجاه والرسم
- إذا حدد المؤشر اتجاهًا صاعدًا، فإنه يرسم خط Up (السماوي) ويضبط
Trendإلى+1. - إذا اكتشف اتجاهًا هابطًا، فإنه يرسم خط Down (المغنطة) ويضبط
Trendإلى-1. - يتم تحديث الإخراج Main (الرمادي) داخليًا ليعكس مستويات الدعم/المقاومة الحالية.
Trendهو سلسلة إخراج غير مرئية تخزن اتجاه الاتجاه رقميًا (+1أو-1).
- إذا حدد المؤشر اتجاهًا صاعدًا، فإنه يرسم خط Up (السماوي) ويضبط
- الأسهم وحساب النقاط
- عرض الأسهم؟ – إذا تم التفعيل، يرسم المؤشر سهمًا على كل شمعة جديدة حيث يتم اكتشاف انعكاس الاتجاه.
- عرض النقاط؟ – إذا تم التفعيل، يحسب ويعرض فرق النقاط بين الإشارة الأخيرة والإشارة الجديدة، ويرسم تسمية صغيرة وخط اتجاه على الرسم البياني.
الملخص
ملخص الذكاء الاصطناعي
The Half Trend BT indicator detects potential trend reversals by analyzing recent highs and lows over a specified period. It compares two selected price series—typically High and Low, but configurable to other price types such as Open, Close, or Median—using moving averages based on chosen smoothing methods and amplitude periods. The indicator plots an "Up" line (cyan) when an uptrend is detected and a "Down" line (magenta) for a downtrend, while internally storing trend direction numerically (+1 or -1). A main output line (gray) reflects current support and resistance levels. Optional features include drawing arrows on bars where trend reversals occur and calculating pip differences between signals, which are displayed as labels and trendlines on the chart. This indicator supports multiple markets including Forex, indices, commodities, cryptocurrencies, and stocks.
ملف تعريف المؤشر
تقييمات العملاء
4.3
التقييمات: 3
5 | 33 % | |
4 | 67 % | |
3 | 0 % | |
2 | 0 % | |
1 | 0 % |
تقييمات العملاء
March 29, 2025
Clean idea for traders around chart reading. The useful part is adding confirmation before a trade, with the numbers checked before scaling. The cleaner reads should hold across 3 sessions, not just 1 good chart. It is stronger when a 1.5R target is realistic before the entry.
March 28, 2025
March 28, 2025
Decent tool for testing if the trader wants it makes market context easier to scan. It works best as support, not a final decision maker. I would test it on 2 timeframes, 20 signals and a 1R stop plan. it should not be used as a blind entry trigger.
مناقشة
الأسئلة الشائعة
Prop
Forex
Signal
Indices
Commodities
Crypto
Stocks
يتم توفير المنتجات المتاحة من خلال cTrader Store، بما في ذلك روبوتات التداول والمؤشرات والإضافات، من قبل مطوري الطرف الثالث وإتاحتها لأغراض الوصول المعلوماتي والفني فقط. cTrader Store ليس وسيطًا ولا يقدم نصائح استثمارية أو توصيات شخصية أو أي ضمان للأداء المستقبلي.


السعر
48
المبيعات
1.04K
التثبيتات المجانية