Mô tả
Camarilla của Bullitt Traders — Hình dung Cấu trúc. Giao dịch Chính xác.
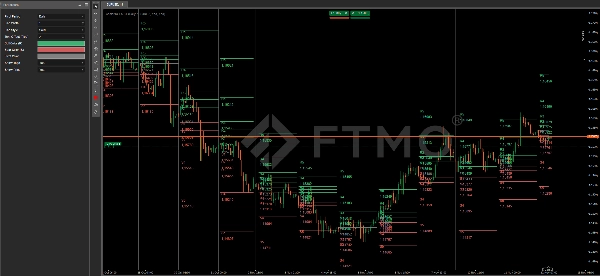
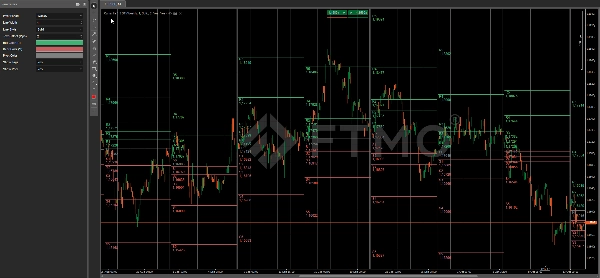
Một chỉ báo pivot Camarilla chuyên nghiệp dành cho cTrader, được xây dựng để tiết lộ cách giá phản ứng quanh các mức tổ chức.
Nó tự động vẽ tất cả các mức Camarilla chính (R1–R5 / S1–S5) và các điểm pivot trên nhiều khung thời gian — cung cấp cho nhà giao dịch một bản đồ cấu trúc rõ ràng cho các điểm đảo chiều và phá vỡ.
Tính Năng Chính
- ✅ Công Thức Camarilla Thật — tính toán các mức từ cao, thấp và đóng cửa của kỳ trước.
- 📊 Logic Đa Khung Thời Gian — chọn giữa các kỳ pivot Hàng Ngày, Hàng Tuần hoặc Hàng Tháng.
- 🕒 Bản Đồ Lịch Sử — tự động vẽ các kỳ trước để cung cấp bối cảnh hình ảnh và phân tích cấu trúc.
- 🎨 Tùy Chỉnh Phong Cách — điều chỉnh độ rộng, kiểu và màu sắc đường theo chế độ (tăng giá, giảm giá, trung tính).
- 💬 Nhãn & Giá — bật hoặc tắt hiển thị văn bản và giá trị để có bố cục gọn gàng hoặc chi tiết.
- ⚡ Nhẹ & Không Tô Lại — tối ưu cho tốc độ và độ chính xác trên mọi ký hiệu.
- 🧩 Hoạt Động Trên Mọi Loại Biểu Đồ — tương thích với thời gian, phạm vi, tick và Renko.
Các Mức Camarilla
R5 – Vùng mục tiêu phá vỡ cực đoan
R4 – Kháng cự chính, kích hoạt phá vỡ tiềm năng
R3 – Vùng đảo chiều trên, thường dùng cho lệnh bán khống
R2 – Kháng cự mức trung bình
R1 – Kháng cự ban đầu, mức phản ứng sớm
PP – Điểm pivot trung tâm (vùng hồi quy trung bình)
S1 – Hỗ trợ ban đầu, mức phản ứng sớm
S2 – Hỗ trợ mức trung bình
S3 – Vùng đảo chiều dưới, thường dùng cho lệnh mua dài
S4 – Hỗ trợ chính, kích hoạt phá vỡ tiềm năng
S5 – Vùng mục tiêu phá vỡ cực đoan
Tham Số
Kỳ Pivot – chọn Hàng Ngày, Hàng Tuần hoặc Hàng Tháng để tính toán mức
Độ Rộng Đường – điều chỉnh độ dày tổng thể của đường
Kiểu Đường – đặt thành Đường liền, Chấm hoặc Gạch ngang
Độ Dời Văn Bản (Pips) – khoảng cách giữa đường và nhãn
Màu Tăng Giá (R) – màu cho các mức kháng cự (R1–R5)
Màu Giảm Giá (S) – màu cho các mức hỗ trợ (S1–S5)
Màu Pivot – màu cho đường pivot trung tâm (PP)
Hiển Thị Nhãn – hiển thị hoặc ẩn tên các mức R/S
Hiển Thị Giá – hiển thị hoặc ẩn nhãn giá số
Cách Sử Dụng
Vùng R3–S3 → khu vực đảo chiều điển hình trong ngày
Mức R4–S4 → xác nhận phá vỡ hoặc tiếp tục xu hướng
R5–S5 → mục tiêu biến động cao và vùng kiệt sức
Tóm tắt
Key features include automatic plotting of historical pivot levels for context, customizable line width, style, and colors for bullish, bearish, and neutral regimes, and options to show or hide level labels and price values. The indicator is lightweight, non-repainting, and compatible with various chart types such as time, range, tick, and Renko charts.
Camarilla levels serve specific roles: R3–S3 zones indicate typical intraday reversal areas; R4–S4 levels suggest breakout or continuation confirmations; and R5–S5 mark extreme breakout targets and high-volatility exhaustion zones. This tool provides a clear structural map to assist traders in identifying potential reversals, breakouts, and target zones across multiple markets including Forex, indices, commodities, cryptocurrencies, and stocks.
Đánh giá của khách hàng
5 | 100 % | |
4 | 0 % | |
3 | 0 % | |
2 | 0 % | |
1 | 0 % |