Descripción
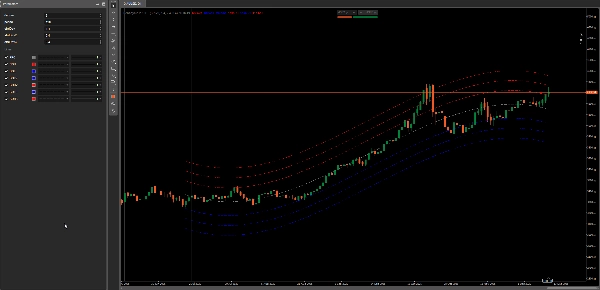
Belkhayate PRC (Canal de Regresión Polinómica)
1 curva. 3 bandas de desviación. Estructura limpia.
Belkhayate PRC es un Canal de Regresión Polinómica con 3 envolventes de desviación estándar.
Te ayuda a identificar zonas medias, expansión y agotamiento de manera sencilla: el precio tiende a oscilar alrededor de una curva de regresión suave — y las bandas externas a menudo actúan como áreas prácticas de reacción.
Esta versión es gratuita, porque quiero que cada trader pueda probarla, entenderla y decidir si se adapta a su flujo de trabajo.
Qué hace
Curva de Regresión Polinómica (PRC)
- Ajusta una curva de regresión suave a las últimas N barras (tu Periodo).
- Grado 1–4: desde un suavizado ligero hasta una curvatura más fuerte.
Bandas de Desviación (3 niveles)
- 3 envolventes basadas en el error de regresión (desviación estándar).
- Útiles como “zonas” para retrocesos, extremos y condiciones de reversión a la media.
Por qué es útil
- Claridad de tendencia sin acumulación lenta de MA
El PRC te ofrece un “centro de gravedad” limpio para el último Periodo. - Extremos estructurados
Las bandas te ayudan a juzgar cuándo el precio está estirado frente a cuándo está en territorio normal. - Ideal para contexto + ejecución
Usa un TF más alto para dirección/contexto y un TF más bajo para entradas en la curva o zonas de banda.
Historia / de dónde viene la idea
Esta herramienta está inspirada en el concepto clásico de canales de regresión usados en análisis técnico (ajustar una línea/curva de regresión al precio y construir envolventes basadas en la desviación).
El nombre “Belkhayate” se asocia comúnmente con una versión popularizada de este canal estilo PRC compartida en comunidades de trading.
Mi implementación en cTrader es una reconstrucción limpia, enfocada en estabilidad, configuraciones y usabilidad práctica en gráficos modernos.
Uso recomendado
- Mercado en tendencia: opera retrocesos hacia el PRC, gestiona el riesgo usando la banda más cercana
- Mercado en rango: opera en contra de los extremos (banda 2 / banda 3) hacia el PRC
- Chequeo de volatilidad: bandas que se ensanchan = volatilidad en expansión / aceleración
Resumen
This indicator helps traders identify mean zones, expansion phases, and exhaustion points by showing how price oscillates around the regression curve, with outer bands often acting as reaction areas. It is applicable across various markets including Forex, indices, commodities, stocks, and cryptocurrencies, supporting symbols like BTCUSD, EURUSD, GBPUSD, XAUUSD, NAS100, and USDJPY.
Recommended uses include trading pullbacks toward the PRC in trending markets, fading extremes in ranging markets, and monitoring volatility through band width changes. The tool is designed for clarity and practical usability on modern charts, suitable for combining higher timeframes for context with lower timeframes for execution.
Valoraciones de clientes
5 | 100 % | |
4 | 0 % | |
3 | 0 % | |
2 | 0 % | |
1 | 0 % |


![Logotipo de "[Stellar Strategies] BOS Trend 1.0"](https://cdn.ctrader.com/image/webp/6cdec0f1-0e97-4a82-a8a4-2b67aed54d38_25695)