
Descripción
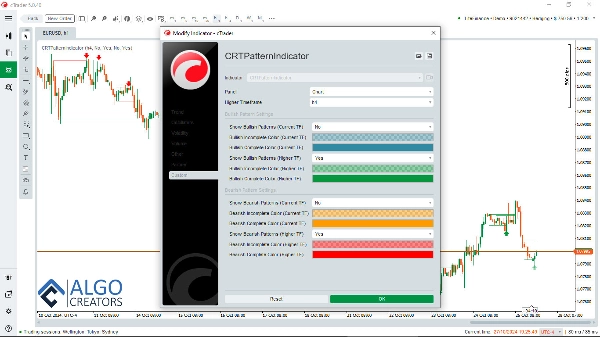
El indicador CRT (Teoría del Rango de Velas) es una herramienta analítica poderosa diseñada específicamente para traders que siguen la metodología ICT (Inner Circle Trader). Este indicador identifica patrones esenciales de velas relacionados con el CRT, que es crucial para entender los movimientos del mercado y la acción del precio.
El indicador CRT para cTrader viene equipado con capacidades multitemporales, permitiendo a los traders ver patrones CRT de marcos temporales superiores (HTF) mientras operan en marcos temporales inferiores (LTF). Esta funcionalidad es vital para obtener información sobre la estructura general del mercado y mejorar las decisiones de trading.
Movimiento del precio y Power of 3 de ICT (AMD):
El indicador CRT simplifica el análisis de los movimientos de precio y el reconocimiento de patrones asociados con el Power of 3 de ICT (Anatomía de la Dinámica del Mercado - AMD).
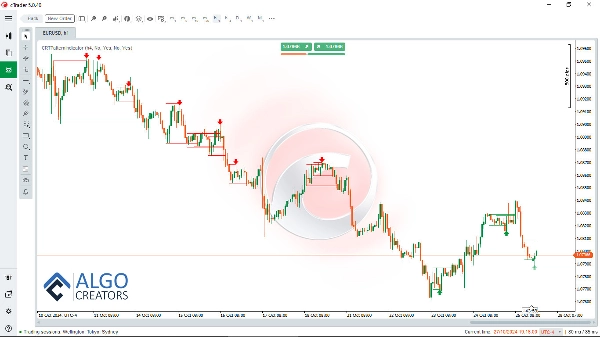
CRT LTF dentro de un CRT HTF:
Al identificar sin esfuerzo los puntos clave de soporte y resistencia, los traders pueden analizar la acción del precio con mucha mayor claridad. Además, el indicador CRT resalta patrones HTF y LTF, ayudando a los traders a navegar las dinámicas de varios ciclos del mercado.
usar el indicador CRT con otros conceptos de trading:
Combinar CRT con otros conceptos de trading como FVGs, bloques de órdenes y turtle soup aumenta la probabilidad de identificar operaciones exitosas.
Además, el indicador CRT sirve como un complemento invaluable para el Smart Money Assistant indicador, una herramienta avanzada diseñada para asistir a los traders de smart money con información crítica del mercado y toma de decisiones. Combinados, estos dos indicadores crean una caja de herramientas integral que mejora la capacidad del trader para analizar y actuar.
Descargar Smart Money Assistant: https://ctrader.com/algos/show/3956/
Para aumentar aún más las estrategias de trading, el FVG Finder indicador puede usarse junto con el indicador CRT. Esta herramienta detecta brechas de valor justo (FVGs) en el gráfico, que, cuando se usan junto con las señales CRT, aumentan la probabilidad de realizar operaciones exitosas.
Descargar indicador FVG finder: https://ctrader.com/algos/show/3877/
Al integrar estos indicadores, los traders pueden establecer un sistema robusto que aprovecha configuraciones de alta probabilidad, permitiéndoles navegar eficazmente los mercados y optimizar sus resultados de trading.
Descargar indicador CRT con Alertas:: www[dot]AlgoCreators[dot]net
Con CRT, Smart Money Assistant y FVG Finder en tu conjunto de herramientas, puedes maximizar tu comprensión de las tendencias del mercado y mejorar tu rendimiento general en el trading, convirtiéndolo en un recurso esencial para traders que desean sobresalir en el estilo de trading ICT.
Resumen
It simplifies the recognition of price movements related to ICT’s Power of 3 (Anatomy of Market Dynamics - AMD) and highlights critical support and resistance levels. By displaying both higher and lower timeframe patterns, it helps traders interpret market cycles more clearly.
The CRT indicator can be combined with other trading concepts such as Fair Value Gaps (FVGs), order blocks, and turtle soup patterns to enhance trade identification. It also complements the Smart Money Assistant indicator, providing a comprehensive toolkit for smart money trading analysis.
Additionally, pairing the CRT indicator with the FVG Finder, which detects Fair Value Gaps, can improve the probability of successful trades. Together, these tools support the development of robust trading strategies aligned with the ICT style.
Valoraciones de clientes
5 | 85 % | |
4 | 15 % | |
3 | 0 % | |
2 | 0 % | |
1 | 0 % |


