
Descripción
GRATIS PARA TODOS
🏎️ RSI Velocity Gauge Pro 📊
El HUD definitivo de momentum en tiempo real y visualizador de tendencias para cTrader
Transforma la forma en que ves el momentum del mercado con el RSI Velocity Gauge Pro. Di adiós a las ventanas de osciladores desordenadas y separadas. Este indicador premium superpone un tablero mecánico elegante directamente en tu gráfico, ofreciéndote una lectura instantánea y de alta fidelidad de la velocidad, fuerza y puntos de agotamiento del mercado.
Diseñado con escalado UI trigonométrico avanzado y lógica de pintura en vivo del gráfico, esto es más que un indicador: es un centro de control ejecutivo completo para tu diseño de trading.
⚡ Características clave
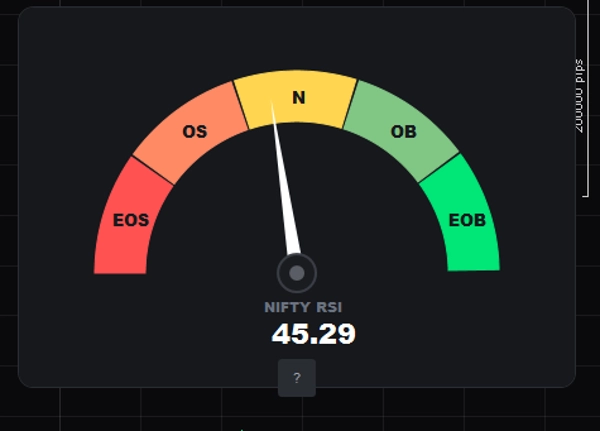
- 🧭 Tablero mecánico dinámico: Un impresionante velocímetro radial en modo oscuro que sigue el Índice de Fuerza Relativa (RSI) en vivo en cada tick.
- 🎨 Codificación de colores psicológicamente correcta: Perfectamente invertida para coincidir con la presión del mercado en tiempo real. El lado izquierdo representa el control abrumador de los vendedores (Rojo/Naranja), mientras que el lado derecho muestra la velocidad agresiva de los compradores (Verde/Menta).
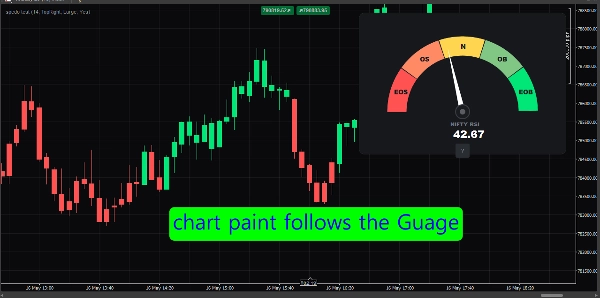
- 🕯️ Pintura inteligente de velas: Mantén tus ojos fijos en la acción del precio. El indicador pinta automáticamente las velas de tu gráfico en verde durante el momentum alcista (RSI > 50) y en rojo durante entornos bajistas (RSI < 50).
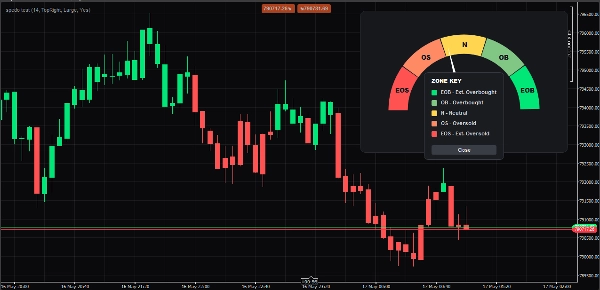
- 🧠 Leyenda emergente interactiva (
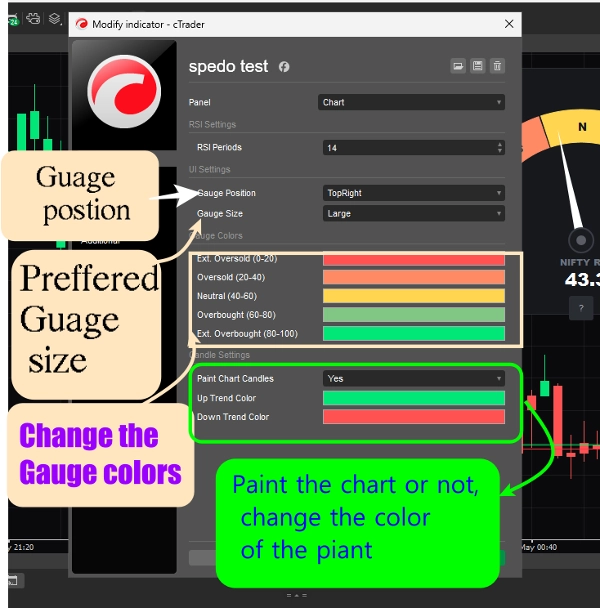
?botón): Mantén tus gráficos limpios y minimalistas. Haz clic en el botón circular interactivo?para alternar instantáneamente una clave de zona elegante y elevada que detalla las abreviaturas exactas y sus colores correspondientes. - 📐 Escalado UI totalmente responsivo: Elige entre vistas Pequeña, Mediana o Grande. El indicador calcula dinámicamente todas las geometrías, tamaños de fuente, márgenes y radios de borde para ajustarse perfectamente a cualquier resolución de monitor (incluido 4K).
- 📍 Posicionamiento fluido en esquinas: Desplaza fácilmente el medidor para no interferir con la acción crítica del precio. Cambia entre Arriba-Izquierda, Arriba-Derecha, Abajo-Izquierda o Abajo-Derecha con ajustes automáticos de relleno.
- 🎛️ Selectores de color nativos: ¡No se requieren tediosos códigos hexadecimales! Personaliza el color de las 5 zonas y las velas de tendencia usando las cuadrículas de color desplegables y fluidas de cTrader.
🔍 La clave de la leyenda de zonas
Haz clic en el botón ? en línea en tu tablero para ver tus reglas personalizadas de zona:
- 🟥 EOS (Extremadamente Sobrevendido | 0–20): Agotamiento máximo de venta. Zona potencial de reversión.
- 🟧 OS (Sobrevendido | 20–40): Fuerte velocidad bajista. Los osos tienen control firme.
- 🟨 N (Neutral | 40–60): Zona de equilibrio del mercado. Acción lateral o de consolidación.
- 🟩 OB (Sobrecomprado | 60–80): Fuerte velocidad alcista. Los toros tienen control firme.
- 🟩 EOB (Extremadamente Sobrecomprado | 80–100): Agotamiento máximo de compra. Zona potencial de retroceso.
⚙️ Parámetros personalizables
- Configuraciones RSI: Ajusta tus períodos de cálculo sin esfuerzo (Predeterminado: 14).
- Posicionamiento UI: Selector de diseño desplegable (Arriba-Izquierda, Arriba-Derecha, Abajo-Izquierda, Abajo-Derecha).
- Tamaño UI: Escalador responsivo fluido (Pequeño, Mediano, Grande).
- Colores del medidor: Selectores de paleta independientes para las 5 bandas de momentum.
- Configuraciones de velas: Interruptor global para habilitar/deshabilitar la pintura de fondo de velas, con selectores personalizados de pincel para tendencias alcistas y bajistas.
Resumen
Key features include automatic candle coloring to reflect bullish (green) or bearish (red) momentum based on RSI values, an interactive pop-up legend explaining zone meanings, and fully responsive UI scaling with adjustable sizes (small, medium, large) and corner positioning options. Users can customize RSI calculation periods, gauge colors for five momentum bands, and toggle candle painting on or off.
The indicator divides RSI values into five zones: Extreme Oversold (0–20), Oversold (20–40), Neutral (40–60), Overbought (60–80), and Extreme Overbought (80–100), helping identify potential reversal or exhaustion points. The RSI Velocity Gauge serves as a comprehensive momentum visualization tool, integrating smoothly into trading layouts for enhanced market speed, strength, and trend analysis.
Valoraciones de clientes
5 | 100 % | |
4 | 0 % | |
3 | 0 % | |
2 | 0 % | |
1 | 0 % |


![Logotipo de "[Stellar Strategies] Smart ADX"](https://cdn.ctrader.com/image/webp/af13b084-b6f6-41db-b7bc-c7e688b57b05_36929)


![Logotipo de "Trend Angle Indicator [Iridio Capital]"](https://cdn.ctrader.com/image/webp/28a98496-3412-4fea-82eb-be3347bdd6f1_27612)


