
说明
⚠️更新享受真实深度信息⚠️
🔥 热力图仪表盘 📈
一个面向cTrader的机构级订单流和动量终端。
这个 热力图仪表盘 不仅仅是一个基本的图表叠加——它是一个直接内置于您的平台中的三部分交易生态系统。它为您提供市场流动性的“X光”视角,真实的成交量加权平均值以及宏观级别的趋势,且不会降低您的计算机速度。⚡
🎯 它的功能(交易者视角)
系统将您的交易分解为三个简单步骤:
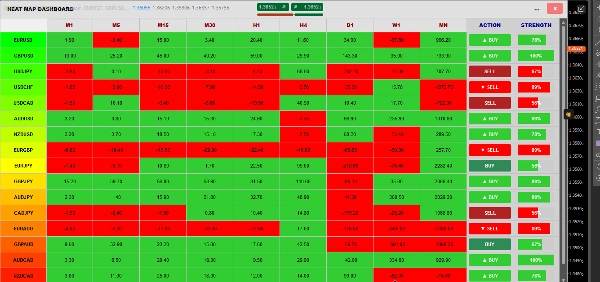
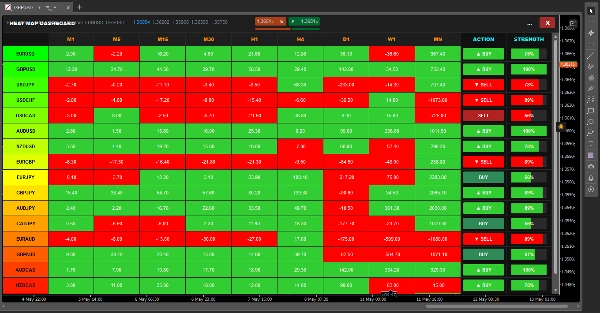
- 🎛️ 步骤1:交易什么(矩阵)。 仪表盘扫描17种不同资产跨9个时间框架(M1到月度),而不是点击查看数十个图表。它计算每个单元格的动量并用颜色编码。一眼就能准确知道哪个货币对处于大趋势并准备交易。
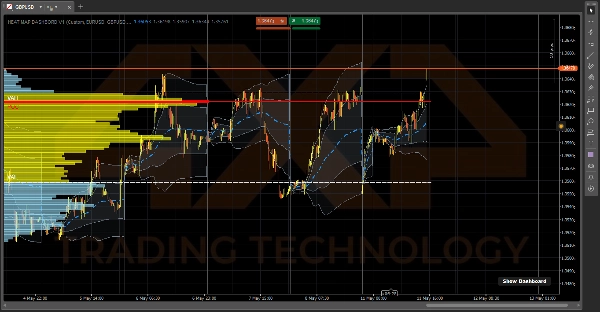
- 🌊 步骤2:谁在控制(VWAP)。 一旦选择货币对,查看 每日锚定VWAP。它显示基于成交量的真实平均价格,而不仅仅是蜡烛图。阴影的标准差云作为动态支撑/阻力,准确显示市场何时严重超买或超卖。
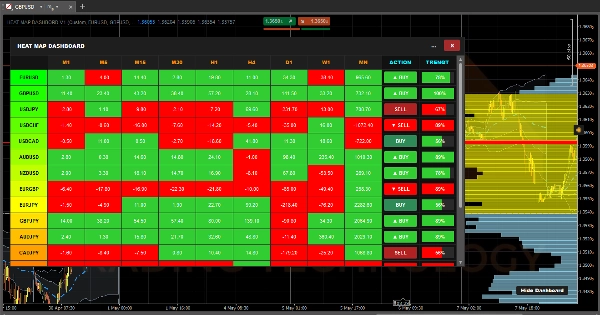
- 📊 步骤3:在哪里入场(VRVP)。 最后,可见范围成交量轮廓 精确映射重机构流动性所在。它自动绘制您的 控制点(POC) 和70% 价值区(VAH & VAL) 线,提供精准的执行入场和退出水平。
⚙️ 工作原理(幕后)
大多数尝试进行如此多计算的指标会立即冻结您的平台并使cTrader崩溃,CPU使用率达到100%。为防止这种情况,热力图仪表盘 由三个高度优化、独立且同时运行的引擎驱动:
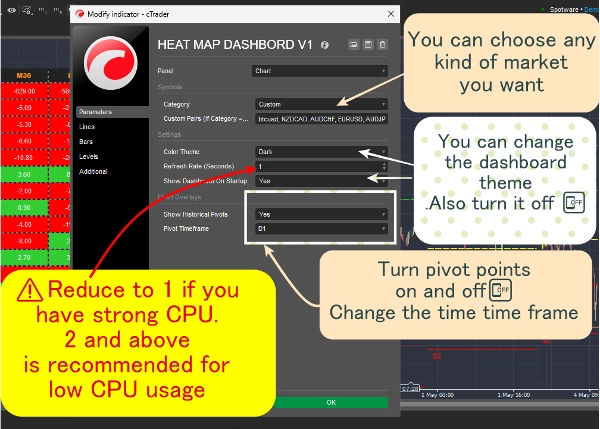
1. 仪表盘引擎(2秒心跳)⏱️ 如果我们在每个价格波动上计算153种组合(17对x 9时间框架),您的电脑会崩溃。相反,该引擎运行严格的 2秒心跳定时器。每2秒,它静默查看14根蜡烛前的价格,与当前价格比较,并将单元格涂成绿色(正动量)或红色(负动量)。
2. VRVP引擎(屏幕阅读器)🖥️ 成交量轮廓作为动态“视口监听器”,而非加载数千条历史数据。它仅在您实际缩放或滚动图表时触发。它询问cTrader当前屏幕上可见的蜡烛,计算这些特定条的精确成交量重叠,并即时重绘70%价值区。
3. VWAP引擎(Tick累加器)🧮 VWAP是唯一在实时Tick上计算的部分。为了保持极速,它使用轻量级“累积数据序列”。不是每秒重新计算全天,而是简单地将新Tick的成交量加到后台累计总数,并在午夜时分自动清零。
4. 窗口管理器(变形者)🪟 仪表盘包裹在自定义C#尺寸逻辑中,主动监听您的显示器。当您点击 最大化 [ ] 或 还原 [=] 按钮时,指标动态读取您的 Chart.Width 和 Chart.Height ,即时变形以完美适应您的屏幕且不会崩塌!
摘要
1. Market Momentum Matrix: Scans 17 assets across 9 timeframes (from 1 minute to monthly), calculating and color-coding momentum to identify trending pairs quickly.
2. Daily Anchored Volume Weighted Average Price (VWAP): Displays true average prices weighted by volume, with dynamic standard deviation clouds indicating overbought or oversold conditions.
3. Visible Range Volume Profile (VRVP): Maps institutional liquidity by highlighting the Point of Control (POC) and 70% Value Area (VAH & VAL) within the visible chart range, aiding precise entry and exit levels.
The dashboard operates via four optimized engines: a 2-second heartbeat engine for momentum updates, a viewport-driven VRVP engine for volume profile recalculations, a tick-accumulating VWAP engine for real-time volume-weighted pricing, and a dynamic window manager that adjusts the interface to fit the chart size. This architecture ensures efficient performance and real-time responsiveness. The indicator supports visualization, signals (including trend strength, breakouts, and reversals), and filtering based on tick data, volume, and market structure analysis. It is tagged for aggressive trading, market structure, liquidity sweeps, support/resistance, and risk dashboard functionalities.
客户评价
5 | 100 % | |
4 | 0 % | |
3 | 0 % | |
2 | 0 % | |
1 | 0 % |


