
说明
波动性突破指标 - Hawkes 波动引擎
该指标旨在提供背景信息,而非即时交易操作。波动性组件帮助您了解市场状况的变化——低波动期通常预示着大幅波动的到来,而高波动期最终会耗尽。EWMA 组件让您保持对发展趋势的把握,并突出显示价格何时远离趋势。
将这两种视角——波动性状态和趋势背景——与您自己的交易方法和判断相结合。该指标向您展示环境——您决定如何应对。
版本 2.0
开放未来更新
-----------------------------------------------------------------------------------------------------------------------------------------------------------------------
概述
-----------------------------------------------------------------------------------------------------------------------------------------------------------------------
该指标结合了两个不同的组件,帮助交易者同时识别波动性状态和趋势条件。
第一个组件使用 Hawkes 过程检测市场波动性的变化。与传统波动性指标不同,它不预测方向——仅在市场从平静压缩转向活跃波动或反之时发出信号。可以将其视为波动状态检测器:告诉您市场何时升温或降温,但不指示价格将向哪个方向移动。
第二个组件添加了双重 EWMA(指数加权移动平均)系统,叠加在您的价格图表上。通过快速和慢速移动平均线的交叉,为您提供趋势背景,并通过蜡烛颜色显示价格何时偏离趋势。
-----------------------------------------------------------------------------------------------------------------------------------------------------------------------
工作原理
-----------------------------------------------------------------------------------------------------------------------------------------------------------------------
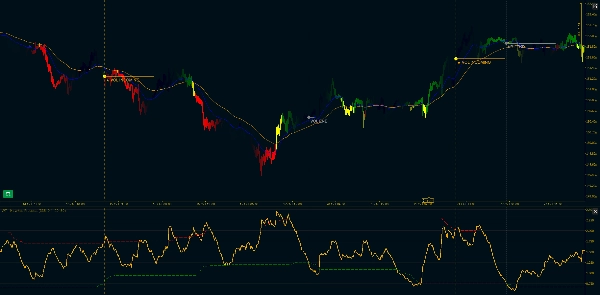
波动性检测: 该指标使用 Parkinson 高低波动率估算器——比标准 ATR 方法更高效,因为它使用了完整的K线范围。此归一化波动率输入到 Hawkes 过程计算中,然后与基于动态分位数的阈值进行比较。
当波动性在一段压缩期后突破上阈值时,您会收到“VOL INCOMING”信号。当波动性回落至下阈值以下时,显示“VOL END”。这些不是入场信号——它们表示波动性状态的变化。市场要么开始活跃,要么进入休眠。
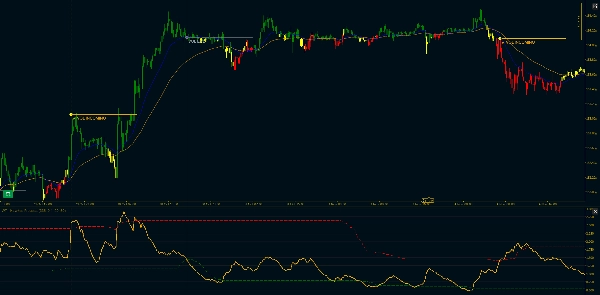
趋势背景: 两条指数加权移动平均线(快速和慢速)显示在主图表上。快速均线为蓝色,慢速均线为橙色。当快速均线高于慢速均线时,趋势向上;反之,则趋势向下。
背离过滤器: 这里变得有趣了。有时价格会显著偏离趋势。当整个蜡烛(开盘价、高价、低价、收盘价)在上升趋势中位于快速均线下方,或在下降趋势中位于快速均线上方时,该柱变为黄色。这是严格的过滤器——即使是影线触及快速均线,颜色也保持正常趋势色。
黄色柱通常出现在回调或疲劳点,但请记住:它们不告诉您接下来会发生什么,只是价格暂时脱离了趋势线。
-----------------------------------------------------------------------------------------------------------------------------------------------------------------------
主要特征
-----------------------------------------------------------------------------------------------------------------------------------------------------------------------
波动性组件:
- Parkinson 高低波动率归一化(比标准 ATR 方法更高效)
- 带可调衰减(Kappa 参数)的 Hawkes 过程计算
- 基于动态分位数的阈值(可自定义百分位数)
- 视觉标记:“VOL INCOMING”表示波动突破,“VOL END”表示压缩
- 连续过滤:仅标记首次突破,而非每次峰值
- 可选的水平趋势线和垂直标记
EWMA 趋势组件:
- 兼容 Pandas 的 EWMA 计算(adjust=True 公式)
- 快速和慢速均线显示在主价格图表上
- 可自定义跨度长度(默认:20/50)
- 最小周期支持(数据不足时抑制输出)
- 处理缺口的忽略 NA 选项
- 三色蜡烛系统:绿色(上升趋势)、红色(下降趋势)、黄色(背离)
自定义选项:
- Parkinson 周期(波动率计算的回溯期)
- Hawkes Kappa(衰减率,影响灵敏度)
- 分位数回溯期
- 低高波动阈值(百分位数)
- 年化切换和区段长度
- 快速和慢速均线跨度
- 看涨、看跌和背离颜色
- 趋势线延伸长度
- 显示/隐藏垂直标记
----------------------------------------------------------------------------------------------------------------------------------------------------------------------------
技术说明: Hawkes 过程组件使用递归指数计算,优化实时使用。EWMA 实现与 Pandas 行为一致,确保与基于 Python 的回测兼容。两个组件均仅在已收盘的K线上计算,以避免重绘。
摘要
客户评价
5 | 100 % | |
4 | 0 % | |
3 | 0 % | |
2 | 0 % | |
1 | 0 % |


