
说明
VWAP (成交量加权平均价) 是一种交易基准,用于计算指定期间内按交易量调整的资产平均价格。它被广泛用于日内交易者、机构和算法交易系统,以评估公平价值并优化交易执行。
关键公式:
VWAP=∑(Price×Volume)/∑Volume
- 价格 = 典型价格(最高价 + 最低价 + 收盘价)/ 3 或仅收盘价。
- 成交量 = 每个周期的交易量。
2. 为什么使用VWAP?
目的:
1)公平价值参考
价格 > VWAP = 看涨偏向;价格 < VWAP = 看跌偏向。
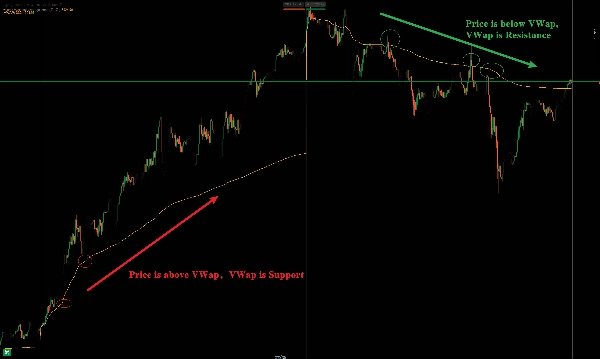
2)动态支撑/阻力
作为日内突破/反转的关键水平。
3) 趋势确认
价格保持在VWAP上方 = 上升趋势;下方 = 下降趋势。
成交量加权平均价 (VWAP) 指标详解及用法
1. 基本概念
VWAP(成交量加权平均价) 是一种技术分析工具,用于衡量资产在特定时间段内的平均交易价格,并根据成交量进行加权计算。它帮助交易者判断当前价格相对于市场的“公平价值”,常用于日内交易、算法交易和机构执行订单。
核心公式:
VWAP=∑(Price×Volume)/∑Volume
每条K线的价格 × 成交量累加,再除以总成交量,得到动态加权均价。
2. VWAP 的主要用途
用途:
1)判断市场公允价格
价格高于VWAP = 偏强;低于VWAP = 偏弱。
2)支撑/阻力参考
VWAP常作为短线交易的动态支撑/阻力位。
3)日内趋势确认
价格持续在VWAP上方 = 多头主导;下方 = 空头主导。
摘要
AI 摘要
Volume Weighted Average Price (VWAP) is a technical indicator that calculates the average price of an asset weighted by trading volume over a specified period. It is widely used by day traders, institutional investors, and algorithmic trading systems to evaluate the fair value of an asset and improve trade execution. The VWAP formula sums the product of price and volume for each period and divides by the total volume. Price input can be the typical price—(High + Low + Close) / 3—or simply the Close price, while volume is the trading volume for each period.
VWAP serves several key functions: it acts as a reference for fair value, where prices above VWAP indicate bullish bias and below indicate bearish bias; it provides dynamic support and resistance levels useful for intraday breakouts and reversals; and it helps confirm intraday trends, with prices sustained above VWAP signaling an uptrend and below signaling a downtrend.
This indicator supports various markets including forex, stocks, indices, commodities, and cryptocurrencies, making it a versatile tool for intraday market analysis and trading strategy development.
指标配置
客户评价
0.0
评价:0
客户评价
该产品尚无评价。已经试过了?抢先告诉其他人!
讨论
常见问答
Prop
Forex
Indices
Commodities
Crypto
Stocks
VWAP
cTrader Store 提供的所有产品,包括交易机器人、指标和插件,均由第三方开发者提供,仅供信息参考和技术访问之用。cTrader Store 并非经纪商,不提供投资建议、个人推荐或任何未来业绩保证。


价格
注册日期 30/09/2024
44
销售