
Описание
Представляем продвинутый индикатор QQE (Qualitative Quantitative Estimation), мощный инструмент, который объединяет два индикатора QQE для улучшенного анализа торговли.
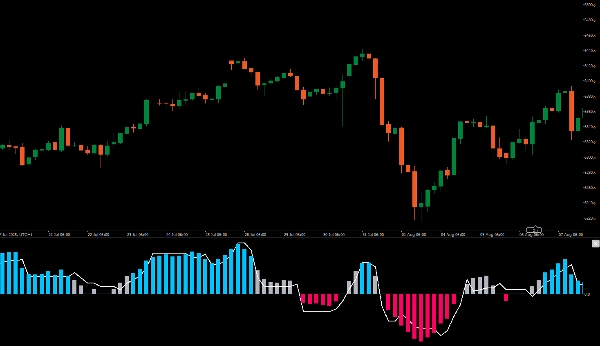
Один QQE отображается на графике в виде столбцов, в то время как другой работает в фоновом режиме с 50-периодной полосой Боллинджера, выступающей в роли нулевой линии.
Эта настройка позволяет визуально оценивать рыночный импульс и четко определять потенциальные точки входа. Когда оба индикатора QQE совпадают, вы увидите четкие синие или красные бары, сигнализирующие о сильных возможностях для покупки или продажи.
Повышайте свою торговую стратегию с помощью индикатора QQE для более обоснованных решений и улучшенной точности в вашем рыночном анализе.Представляем продвинутый индикатор QQE (Qualitative Quantitative Estimation), мощный инструмент, который объединяет два индикатора QQE для улучшенного анализа торговли.
Один QQE отображается на графике в виде столбцов, в то время как другой работает в фоновом режиме с 50-периодной полосой Боллинджера, выступающей в роли нулевой линии.
Эта настройка позволяет визуально оценивать рыночный импульс и четко определять потенциальные точки входа. Когда оба индикатора QQE совпадают, вы увидите четкие синие или красные бары, сигнализирующие о сильных возможностях для покупки или продажи.
Повышайте свою торговую стратегию с помощью индикатора QQE для более обоснованных решений и улучшенной точности в вашем рыночном анализе.
Сводка
Отзывы покупателей
5 | 100 % | |
4 | 0 % | |
3 | 0 % | |
2 | 0 % | |
1 | 0 % |


