Mô tả
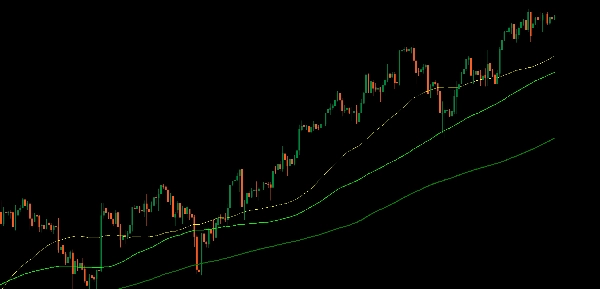
Giới thiệu chỉ báo Moving Average nâng cao, được thiết kế để tùy chỉnh và linh hoạt hơn trong phân tích giao dịch của bạn.
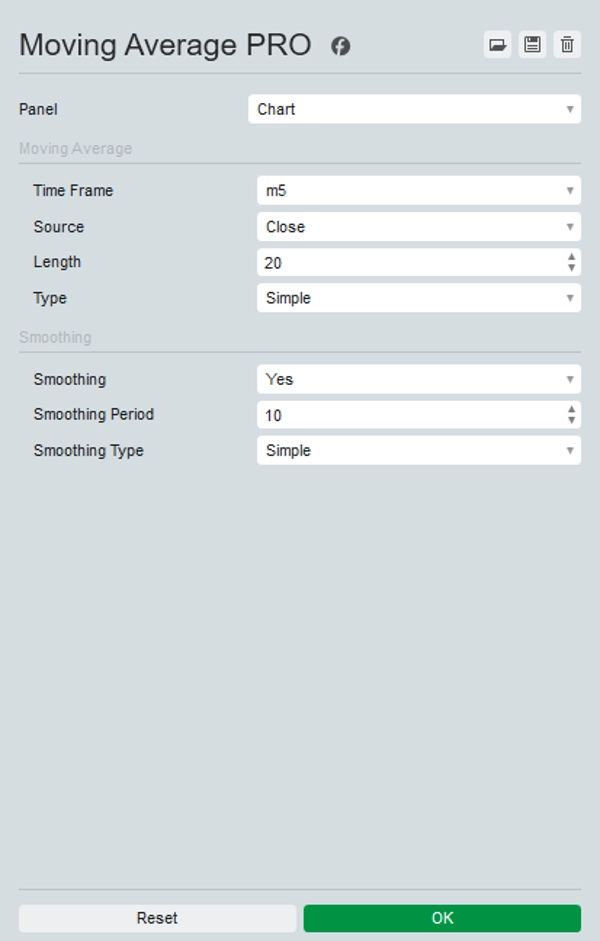
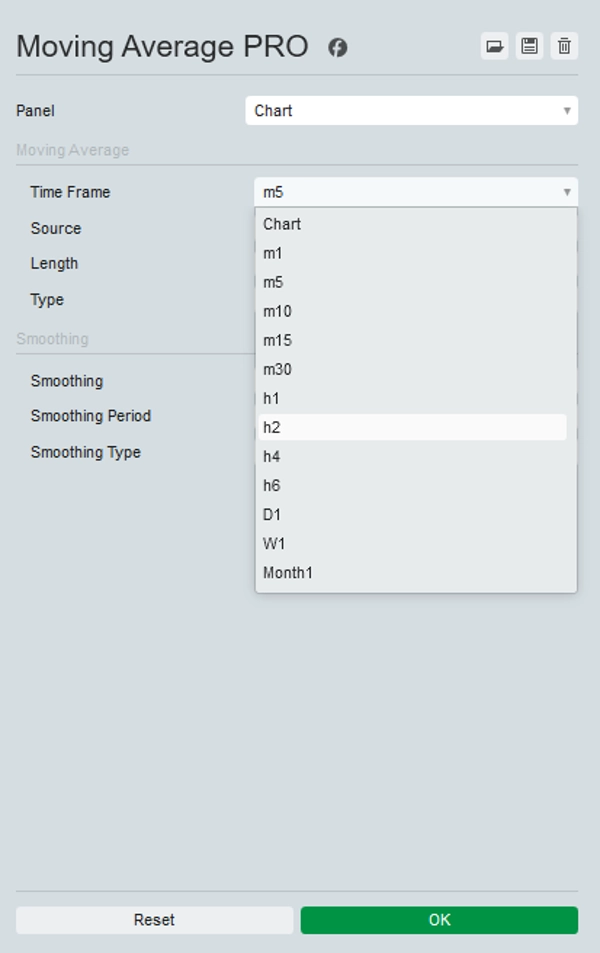
Phiên bản nâng cao này cũng hỗ trợ các đường trung bình động khung thời gian cao hơn cho các khung thời gian tick và Heikin Ashi. Renko và các khoảng Range hiện chưa được hỗ trợ.
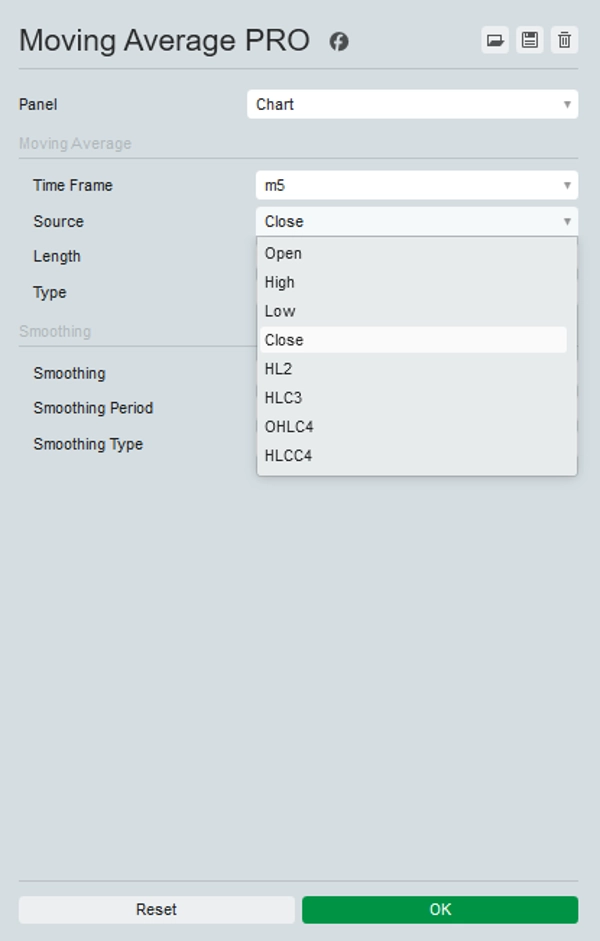
Chỉ báo này cho phép bạn chọn bất kỳ khung thời gian nào, cho phép bạn hiển thị, ví dụ, MA 200 hàng ngày trên bất kỳ khung thời gian nào khác.
Ngoài ra, nó cung cấp một loạt các nguồn giá để lựa chọn, bao gồm Open, High, Low, Close, HL2, HLC3, OHLC4, và HLCC4, giống như trong TradingView và các tùy chọn làm mượt tùy chọn để giải quyết các vấn đề lấy mẫu trên các khung thời gian thấp hơn.
Bằng cách cung cấp các tùy chọn này, bạn có thể điều chỉnh Moving Average phù hợp với chiến lược giao dịch cụ thể của mình và có được những hiểu biết chính xác hơn về xu hướng thị trường.
Nâng cấp bộ công cụ giao dịch của bạn với chỉ báo Moving Average nâng cao để phân tích và ra quyết định tốt hơn.
Tóm tắt
Đánh giá của khách hàng
5 | 100 % | |
4 | 0 % | |
3 | 0 % | |
2 | 0 % | |
1 | 0 % |