
Mô tả
Giới thiệu chỉ báo True Strength Index (TSI), một công cụ mạnh mẽ được thiết kế để nâng cao chiến lược giao dịch của bạn bằng cách cung cấp những hiểu biết rõ ràng về động lượng thị trường và sức mạnh xu hướng.
Chỉ báo TSI đo lường sức mạnh cơ bản của các biến động giá, làm mượt nhiễu thị trường để cung cấp cho bạn một bức tranh chính xác hơn về hướng xu hướng. Bằng cách làm nổi bật các điều kiện mua quá mức và bán quá mức, TSI giúp bạn xác định các điểm đảo chiều tiềm năng và xác nhận sự tiếp diễn của xu hướng.
TSI sử dụng trung bình động của động lượng cơ bản của một công cụ tài chính. Động lượng được coi là một chỉ báo dẫn đầu của biến động giá, và trung bình động thường đi sau giá. TSI kết hợp những đặc điểm này để tạo ra một chỉ báo về giá và hướng đi đồng bộ hơn với các chuyển động thị trường so với chỉ động lượng hoặc trung bình động riêng lẻ.
Hoàn hảo cho các nhà giao dịch muốn tinh chỉnh phân tích và cải thiện quyết định, chỉ báo TSI cung cấp một cách đáng tin cậy và trực quan để đánh giá động lực thị trường. Nâng cấp bộ công cụ giao dịch của bạn với True Strength Index để có hiệu suất giao dịch vượt trội.
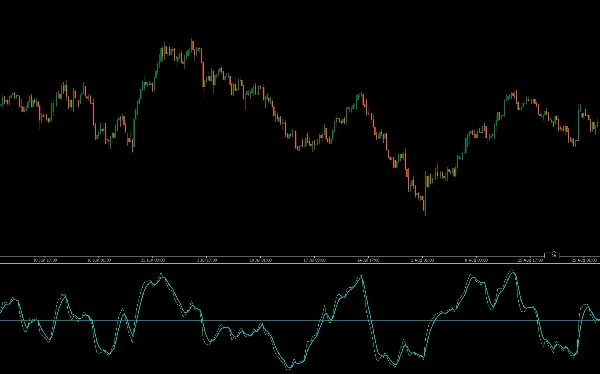
- Xác định xu hướng: TSI dương cho thấy xu hướng tăng, trong khi TSI âm gợi ý xu hướng giảm.
- Sức mạnh động lượng: Nó đo mức độ mạnh mẽ của một xu hướng, với các giá trị cao hơn biểu thị động lượng mạnh hơn.
- Tín hiệu đảo chiều tiềm năng:
-
- Giao cắt: Giao cắt đường tín hiệu gần đường số không có thể báo hiệu các điểm vào và ra tiềm năng.
- Phân kỳ: Khi giá tạo đỉnh hoặc đáy mới, nhưng TSI không làm như vậy, điều này có thể báo hiệu một sự đảo chiều xu hướng tiềm năng.
- Điều kiện mua quá mức/bán quá mức: Nó có thể giúp xác định khi một tài sản có thể bị mua quá mức hoặc bán quá mức, mặc dù các mức mua quá mức và bán quá mức cụ thể có thể thay đổi tùy thuộc vào biến động của tài sản.
Tóm tắt
Đánh giá của khách hàng
5 | 0 % | |
4 | 100 % | |
3 | 0 % | |
2 | 0 % | |
1 | 0 % |


