present
Inscrivez-vous et bénéficiez d'une remise de 50 $ sur votre premier achat
Trading product for BubbleXRay Indicateur Key Levels Liquidity Sweep, image 1
BubbleXRay
Indicateur
15 achats
Version 1.2, Aug 2026
Windows, Mac
4.3
Avis : 3
Trading product for BubbleXRay Indicateur Key Levels Liquidity Sweep, image 2
Trading product for BubbleXRay Indicateur Key Levels Liquidity Sweep, image 3
Trading product for BubbleXRay Indicateur Key Levels Liquidity Sweep, image 4
Trading product for BubbleXRay Indicateur Key Levels Liquidity Sweep, image 5
Trading product for BubbleXRay Indicateur Key Levels Liquidity Sweep, image 6
Trading product for BubbleXRay Indicateur Key Levels Liquidity Sweep, image 7
Trading product for BubbleXRay Indicateur Key Levels Liquidity Sweep, image 8
Trading product for BubbleXRay Indicateur Key Levels Liquidity Sweep, image 9
Depuis le 09/02/2026
20
Ventes
147
Installations gratuites

Description

BUBBLEXRAY — LE VOLUME DE BULLES ULTIME POUR CTRADER (VERSION 🇧🇷 CI-DESSOUS)

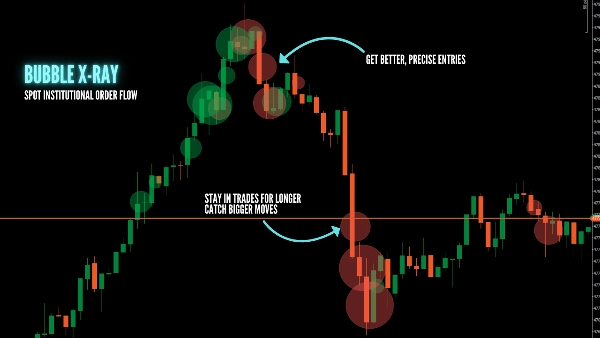
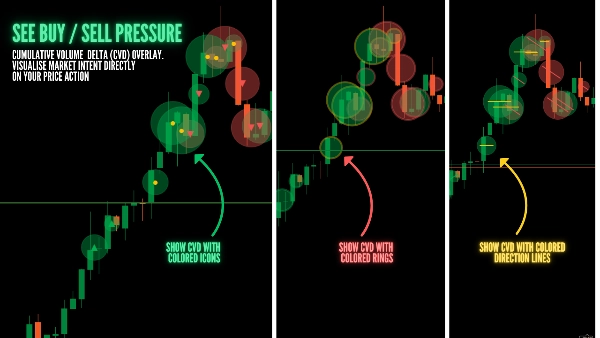
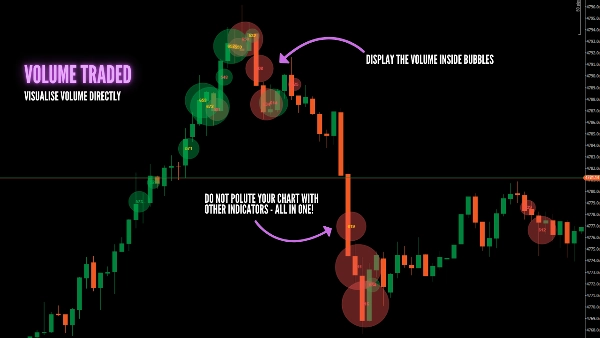
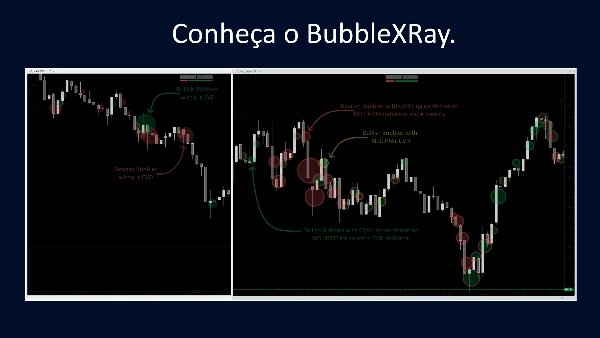
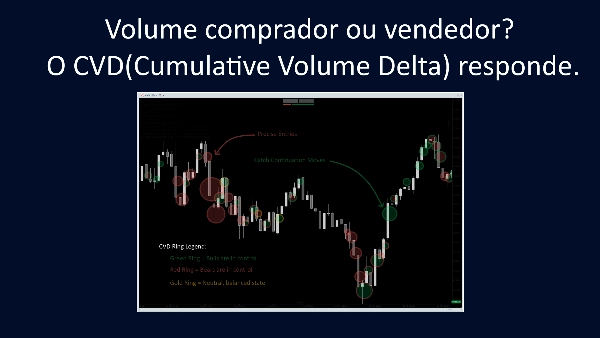
Repérez où l'argent réel circule. BubbleXRay identifie les pics de volume élevé et les affiche sous forme de bulles proportionnelles directement sur votre action de prix. Affichez le changement du delta de volume cumulé (CVD) intégré dans un seul indicateur, sans encombrer ni polluer votre graphique. Plus de suppositions—voyez les empreintes institutionnelles au moment où elles se produisent.

✅ POURQUOI UTILISER BUBBLEXRAY ?

  • Pics d'Activité Instantanés : Les bulles se forment dès qu'une barre de volume élevé se ferme.
  • Empreintes Institutionnelles : De grandes bulles à des niveaux clés révèlent où les gros acteurs sont actifs.
  • Intelligence CVD : Le delta de volume cumulé intégré montre si la poussée était une pression d'achat ou de vente.
  • Auto-Échelle : La fenêtre de percentile roulante s'adapte à toute condition de marché (tendance ou latéralisation).
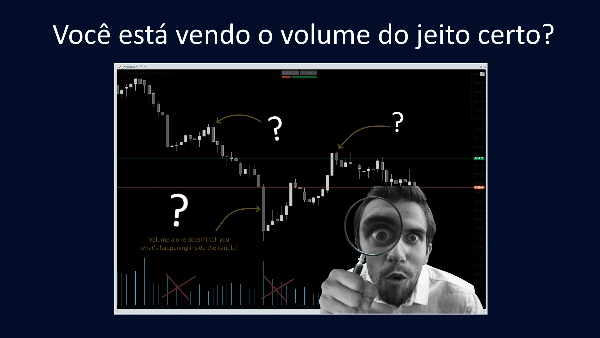
  • Ancré au Prix : Le volume est affiché au niveau de prix exact, pas caché dans un histogramme en sous-fenêtre.

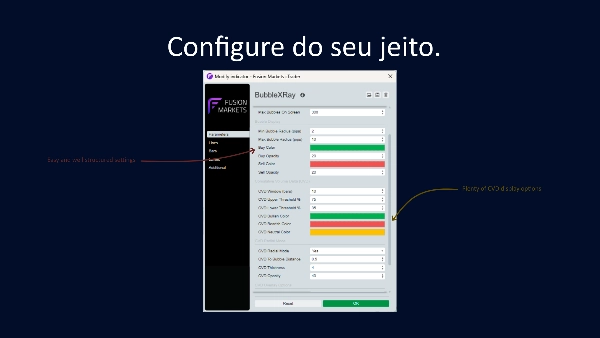
Exemple de Préréglage : Or (XAUUSD) - Graphique 1M

  • Seuil de Percentile de Volume : 50
  • Fenêtre de Percentile (barres) : 250
  • Nombre Maximal de Bulles à l'Écran : 20
  • Rayon Min des Bulles (pips) : 5 ➡ (exemple pour EUR/USD : 0.1)
  • Rayon Max des Bulles (pips) : 20 ➡ (exemple pour EUR/USD : 0.8)
  • Période de Roulement CVD (barres) : 10
  • Retour en Arrière de la Pente CVD (barres) : 7
  • Facteur Plat CVD : 1.8
  • Mode Radial CVD : Non
  • Distance CVD à la Bulle : 0.5
  • Épaisseur CVD : 4
  • Opacité CVD : 40
  • Options de Superposition CVD : Non
  • Mode Débogage : Non

📺 REGARDEZ LE TUTORIEL & REJOIGNEZ LA COMMUNAUTÉ :


(Veuillez poster vos questions/demandes de support dans les commentaires de la vidéo pour aider notre communauté à grandir !)

🛠️ CARACTÉRISTIQUES CLÉS :

  • Dimensionnement Proportionnel : La taille des bulles évolue linéairement avec la magnitude du volume.
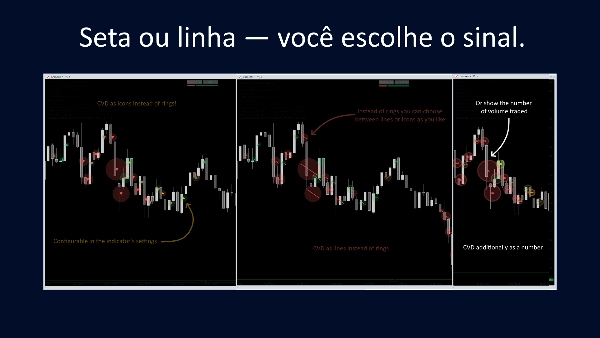
  • Double Confirmation : Combinez l'Anneau Radial et la Flèche de Superposition pour un contexte CVD plus approfondi.
  • Configuration Zéro : Sélectionne automatiquement la meilleure période de données pour votre graphique.
  • Interface Propre : Opacité configurable et limites d'affichage pour garder vos graphiques professionnels.

🇧🇷 BUBBLEXRAY — LE RADIOGRAPHIE DE VOLUME DÉFINITIVE POUR CTRADER

Identifiez où le "Smart Money" agit. Le BubbleXRay marque les pics de volume élevé avec des bulles proportionnelles directement sur le prix. Affichez la variation cumulée du volume (CVD) intégrée dans un seul indicateur, sans surcharger ni polluer votre graphique. Fini les doutes : voyez la trace institutionnelle au moment où elle se produit.

✅ POURQUOI UTILISER BUBBLEXRAY ?

  • Pics d'Activité Instantanés : Les bulles apparaissent dès qu'une barre de volume élevé se ferme.
  • Traces Institutionnelles : De grandes bulles à des niveaux clés révèlent l'activité des gros acteurs.
  • Intelligence CVD : Le delta de volume cumulé intégré montre si la pression était d'achat ou de vente.
  • Auto-ajustable : Le système de percentile s'adapte à tout marché (tendance ou latéralisation).
  • Ancré au Prix : Le volume est affiché au niveau exact de l'action, pas caché dans des histogrammes inférieurs.

📺 REGARDEZ LE TUTORIEL ET RÉPONDEZ À VOS QUESTIONS :


(Veuillez poster vos questions et demandes de support dans les commentaires de la vidéo ci-dessus, ainsi nous aidons le maximum de personnes !)

🛠️ POINTS TECHNIQUES :

  • Taille Proportionnelle : Le rayon de la bulle évolue selon la magnitude du volume.
  • Double Confirmation : Utilisez l'Anneau Radial et la Flèche Interne pour un contexte CVD approfondi.
  • Configuration Zéro : Sélectionne automatiquement la meilleure période de données pour votre graphique.
  • Interface Propre : Opacité et limites d'affichage configurables pour garder votre setup professionnel.


Résumé

Résumé IA
BubbleXRay is a volume-based trading indicator designed for the cTrader platform that visualizes institutional order flow through proportional volume bubbles directly on price charts. It highlights high-volume spikes as bubbles sized according to volume magnitude, enabling traders to identify where significant market participants are active. The indicator integrates Cumulative Volume Delta (CVD) data to distinguish buying versus selling pressure, providing deeper insight into volume dynamics without cluttering the chart. Key features include instant detection of volume spikes upon bar close, auto-scaling via a rolling percentile window adaptable to trending or ranging markets, and price-anchored volume display rather than separate histograms. Additional functionalities include dual confirmation using radial rings and overlay arrows for enhanced CVD context, zero-configuration automatic timeframe selection, and customizable opacity and display limits for a clean user interface. The indicator supports analysis of key market structure concepts such as key levels, liquidity sweeps, imbalances, supply and demand zones, and support/resistance. A preset example configuration is provided for Gold (XAUUSD) on a 1-minute chart. A tutorial video is available to assist users in setup and application. BubbleXRay requires volume and tick data and outputs visual signals directly on price charts.
Profil de l'indicateur
Catégorie de l'indicateur
Volume
Type de résultat
Visualisation
Exigences en matière de données
Volume
Données de tick
Barres seulement

Avis clients

4.3
Avis : 3
5
33 %
4
67 %
3
0 %
2
0 %
1
0 %
Avis clients
April 25, 2026
the signal needs a real reason behind it, but one oversized trade can ruin the day.
April 20, 2026
It becomes more useful when it makes overtrading easier to notice. Size control still matters.
April 16, 2026
The first 10 trades should stay boring. Bad setups become easier to pass on, and the chart still needs a final look.

Discussion

Questions fréquentes

Key Levels
Liquidity Sweep
Imbalance
Volume
Supply & Demand
Liquidity Grab
Support & Resistance
Les produits disponibles sur cTrader Store, notamment les bots de trading, les indicateurs et les plug-ins, sont fournis par des développeurs tiers et mis à disposition à titre informatif et à des fins d'accès technique uniquement. cTrader Store n'est pas un courtier et ne fournit aucun conseil en investissement, aucune recommandation personnelle ni aucune garantie quant aux performances futures.

Plus de cet auteur

Indicateur
BOS
CHOCH
+5
Spot market structure shift with ease, overlay timeframes, avoid false breakouts with open close pivots, hide chart bars
Indicateur
Forex
EURUSD
+5
Fimathe Indicator - Fimathe PCM - Automated Trend Channels & Levels — Ideal for live trading and backteting
Logo de "ZigXRay"
Les mieux notés
4.6
(5)
$29
/
$49
Indicateur
CHOCH
Key Levels
+5
ZigZag Market Structure Identifier - Multi-Layer Scanner: Convergent Pivot Detection, 4-TF Overlay & Naked Chart Mode.
cBot
Fixed Lot
TP Manager
+5
Hotkeys Trading Assistant - Professional Shortcut Assitant with Risk Manager, Hotkeys & Lot Sizing.
Logo de "DrbcLevels"
Les mieux notés
4.0
(4)
$19
/
$29
Indicateur
Key Levels
Break & Retest
+5
Premium Discount Levels - Professional Dealing Range Zones with Draggable Lines, Alerts, Wartermark & Backtest Mode.
Logo de "fvg_levels"
Les mieux notés
4.0
(4)
$19
/
$29
Indicateur
Key Levels
Order Block
+5
FVG Levels — Auto-Detection of Multi-Timeframe Fair Value Gaps & GAPs, Smart Filters and Liquidity Zone Monitoring

Vous pourriez aussi aimer

Indicateur
Prop
Forex
+14
Stochastic Momentum Index (SMI) for cTrader optional higher-timeframe source, and clear overbought/oversold levels.
Indicateur
BOS
MSS
+2
Stay ahead with a real-time countdown to candle closes on all key timeframes: 5m, 15m, 30m, 1H, 4H, and Daily.
Indicateur
Signal
Supertrend
Multi-symbol multi-timeframe SuperTrend panel with watchlist, one-click jump, and alerts.
Logo de "ZigZagSmartAlert"
Les mieux notés
4.2
(4)
$19
/
$30
Indicateur
ZigZag Smart Alert for cTrader Description: ZigZag Smart Alert is a next-generation swing indicator for cTrader, designe
Indicateur
AI
BOS
+4
Golden Boom and Crash Spike Detector is a trading tool designed for Crash 300 and Boom 300 indices on M1 Timeframe.
Indicateur
Forex
BTCUSD
+11
Next-gen Volume Oscillator using Hyperbolic Tangent math. No repainting. Includes arrows, alerts, and overlay mode 🎯
Indicateur
BOS
Fibonacci
+4
Automatically draws major trading sessions, killzones, and SMC daily liquidity targets directly on your cTrader charts.
Indicateur
ATR
MSS
+5
Grades ICT Unicorn setups (Breaker Block + FVG confluence) into PRIME / SETUP / WATCH, with retest & RR targets.
Indicateur
AI
ATR
+20
Detects smart money activity using advanced tick volume and price divergence analysis.
Indicateur
ATR
Channel
Reversal Trap Probability Bands plots a dynamic volatility envelope around price & automatically detects "trap" reversal
Indicateur
ATR
BOS
+3
Fair Value Gaps with Multi-Timeframe.
Indicateur
Imbalance
Inside Bar
+3
A clean and powerful Smart Money Concepts tool combining Fair Value Gaps, Previous Daily High/Low, Inside/Outside bar
Indicateur
Signal
Cumulative Volume Delta tracks the net difference in tick volume between buying and selling pressure over time
Indicateur
AI
SMC
+4
Weekly Daily Opening Gaps — NWOG & NDOG Indicator Professional-grade opening gap visualization for institutional traders
Indicateur
Prop
Forex
+5
Pivot Point with base zone daily Asia-London-New york Session.
Indicateur
Forex
Crypto
+2
A powerful cTrader indicator with customizable Moving Average alerts, notifications, and automated trading actions.
Indicateur
BOS
CHOCH
+5
MyZTrade High TF candle is a multi-timeframe visualisation tool that overlays completed higher-timeframe candles.
Indicateur
BOS
MSS
+3
Orderblocks with Multi-Timeframe.

Prix

Depuis le 09/02/2026
20
Ventes
147
Installations gratuites