
คำอธิบาย
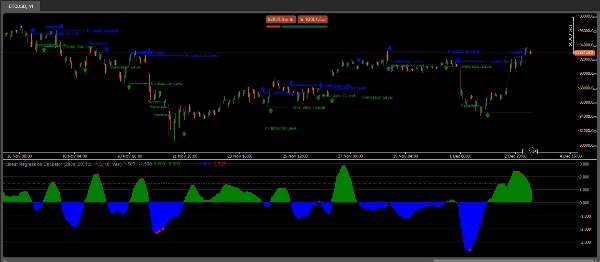
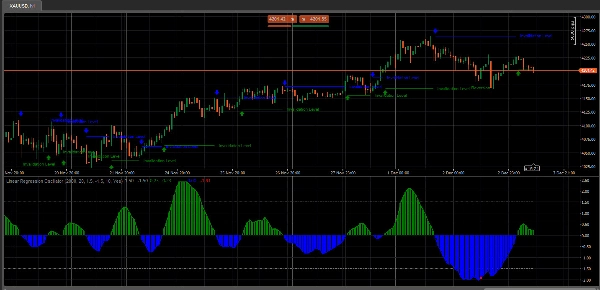
The Linear Regression Oscillator (LRO) เป็นตัวชี้วัดทางเทคนิคที่อิงจากการวิเคราะห์การถดถอยเชิงเส้น ซึ่งมักใช้ในตลาดการเงินเพื่อประเมินโมเมนตัมและทิศทางของแนวโน้มราคา โดยจะวัดระยะห่างระหว่างราคาปัจจุบันกับค่าที่ทำนายโดยเส้นถดถอยเชิงเส้น ซึ่งโดยพื้นฐานคือเส้นที่เหมาะสมที่สุดในช่วงเวลาที่กำหนด นี่คือการอธิบายวิธีการทำงานและส่วนประกอบของมัน:
ส่วนประกอบหลักของ Linear Regression Oscillator
- เส้นถดถอยเชิงเส้น (เส้นที่เหมาะสมที่สุด): เส้นนี้แสดงถึงการเคลื่อนไหวของราคาที่คาดหวังในช่วงเวลาหนึ่งและคำนวณโดยใช้เทคนิคการถดถอยเชิงเส้น ความชันของเส้นบ่งชี้ทิศทางของแนวโน้ม: ความชันบวกแสดงถึงแนวโน้มขาขึ้น ในขณะที่ความชันลบชี้ไปที่แนวโน้มขาลง
- ค่าของ Oscillator: ค่าของ oscillator คำนวณโดยการวัดความเบี่ยงเบนระหว่างราคาปัจจุบันกับเส้นถดถอยเชิงเส้น ความเบี่ยงเบนนี้จะถูกพล็อตเป็นค่า oscillator ซึ่งโดยทั่วไปจะสวิงรอบเส้นศูนย์
- เส้นศูนย์: เส้นศูนย์ในกราฟ LRO ทำหน้าที่เป็นเส้นฐาน เมื่อค่า oscillator ข้ามขึ้นเหนือเส้นศูนย์ จะบ่งชี้ถึงโมเมนตัมขาขึ้น และการข้ามลงต่ำกว่าเส้นศูนย์บ่งชี้ถึงโมเมนตัมขาลง
- การตั้งค่าและช่วงเวลา: การตั้งค่าช่วงเวลากำหนดจำนวนแท่งหรือจุดข้อมูลที่ใช้ในการคำนวณเส้นถดถอยเชิงเส้น เทรดเดอร์ปรับการตั้งค่านี้ให้เหมาะสมกับกลยุทธ์การเทรดระยะสั้นหรือระยะยาว ขึ้นอยู่กับกรอบเวลาการวิเคราะห์ที่ต้องการ
วิธีที่เทรดเดอร์ใช้ Linear Regression Oscillator
- การระบุแนวโน้ม: LRO ช่วยให้เทรดเดอร์เห็นว่าแนวโน้มราคาปัจจุบันมีโมเมนตัมหรือไม่ โดยแสดงระยะห่างสัมพัทธ์ระหว่างราคาและเส้นถดถอยที่คาดหวัง
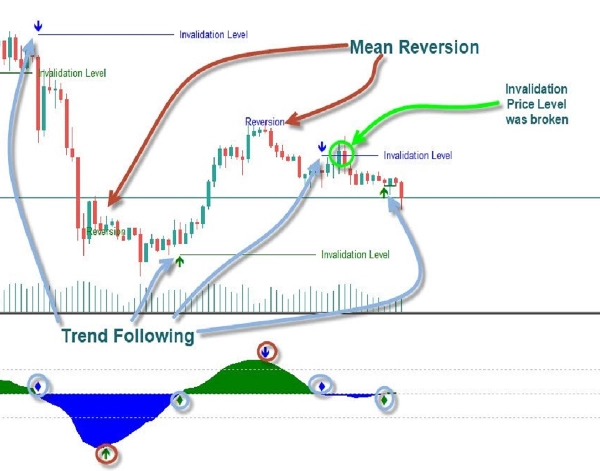
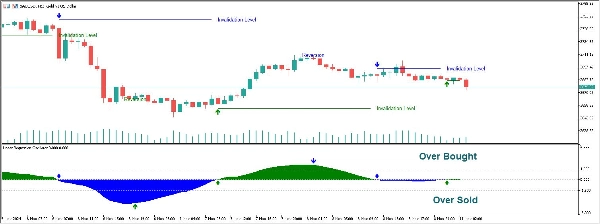
- ระดับซื้อมาก/ขายมากเกินไป: ค่าที่สุดโต่งใน oscillator สามารถบ่งชี้ถึงสภาวะซื้อมากหรือขายมากเกินไป ซึ่งแนะนำถึงการกลับตัวที่อาจเกิดขึ้นหรือความจำเป็นในการปรับตำแหน่ง
- สัญญาณความแตกต่าง: เมื่อการเคลื่อนไหวของราคาและตัวชี้วัด LRO แตกต่างกัน อาจเป็นสัญญาณของโมเมนตัมที่อ่อนแอลงหรือการกลับตัวที่เป็นไปได้
เคล็ดลับการตีความ
- การข้ามเส้นศูนย์: การข้ามขึ้นเหนือศูนย์อาจบ่งชี้ถึงแนวโน้มขาขึ้นที่กำลังเกิดขึ้น ในขณะที่การข้ามลงต่ำกว่าศูนย์บ่งชี้ถึงแนวโน้มขาลง
- การปรับช่วงเวลา: ช่วงเวลาที่สั้นกว่าจะทำให้ LRO มีความไวมากขึ้น จับการเคลื่อนไหวของราคาได้รวดเร็วแต่เพิ่มเสียงรบกวน ช่วงเวลาที่ยาวกว่าจะช่วยลดความผันผวน เหมาะสำหรับการระบุแนวโน้มระยะยาว
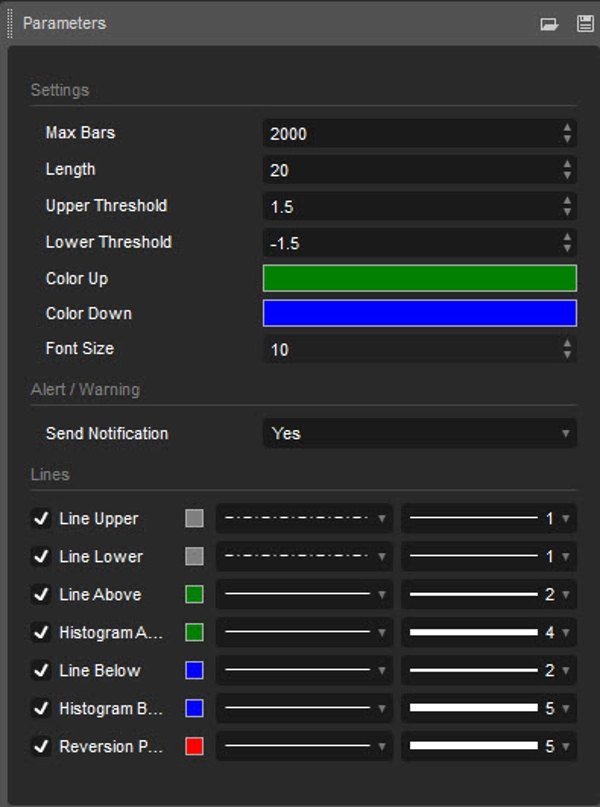
หมายเหตุการใช้งาน:
- ความยาว: กำหนดช่วงเวลาที่ใช้ในการคำนวณการถดถอยเชิงเส้น
- เกณฑ์บน/ล่าง: กำหนดขอบเขตบนและล่างสำหรับการระบุสภาวะซื้อมากและขายมากเกินไป ค่าที่อยู่นอกเกณฑ์เหล่านี้บ่งชี้ถึงการกลับตัวที่เป็นไปได้
Linear Regression Oscillator มีคุณค่าในการรวมการวิเคราะห์ทางสถิติเข้ากับหลักการติดตามแนวโน้ม ทำให้เป็นเครื่องมือที่หลากหลายสำหรับทั้งเทรดเดอร์โมเมนตัมและเทรดเดอร์แนวโน้ม โดยเฉพาะอย่างยิ่งในตลาดที่มีแนวโน้ม ซึ่งช่วยระบุการต่อเนื่องของแนวโน้มหรือการกลับตัวโดยอิงจากความเบี่ยงเบนจากเส้นแนวโน้มถดถอย
สรุป
รีวิวจากลูกค้า
5 | 0 % | |
4 | 100 % | |
3 | 0 % | |
2 | 0 % | |
1 | 0 % |


