
Açıklama
- Grafiklerinizi trend netliğinin görsel bir senfonisine dönüştürün.
MARainbow Göstergesi, hassasiyet, esneklik ve estetik netlik talep eden tüccarlar için tasarlanmış şık, çok katmanlı bir hareketli ortalama aracıdır. İster günlük hareketleri skalp yapıyor olun, ister uzun vadeli trendleri analiz edin, MARainbow size anında tanıma için renk kodlu dört özelleştirilebilir hareketli ortalama ile avantaj sağlar.
🔧 Temel Özellikler
• Dört Farklı Hareketli Ortalama
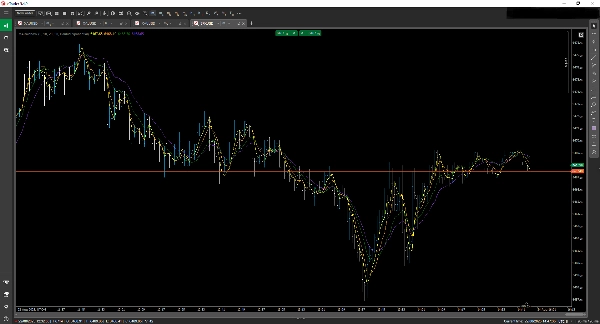
Hızlı görsel ayırt etme için her biri kendi renk ve dönem ayarına sahip 4 hareketli ortalamayı aynı anda görüntüleyin.
• Çoklu MA Türleri
Şunlardan seçim yapın:
• Basit Hareketli Ortalama (SMA)
• Üssel Hareketli Ortalama (EMA)
• Çift Üssel Hareketli Ortalama (DEMA)
• Ve diğerleri.
Stratejinize uygun şekilde karıştırıp eşleştirin.
• Özelleştirilebilir Girdiler
• Her MA için ayrı dönemler seçin
• Daha iyi grafik okunabilirliği için benzersiz renkler atayın
• Her çizginin görünürlüğünü bağımsız olarak açıp kapatın
• Bir Bakışta Trend Netliği
Gökkuşağı efekti, trend yönünü, gücünü ve olası dönüşleri anında tanımlamanıza yardımcı olur—artık ikinci tahminlere gerek yok.
• cTrader için Optimize Edildi
cTrader platformuyla sorunsuz entegrasyon sağlar, akıcı performans ve sezgisel ayarlar sunar.
Özet
Müşteri değerlendirmeleri
5 | 0 % | |
4 | 100 % | |
3 | 0 % | |
2 | 0 % | |
1 | 0 % |


