
Açıklama
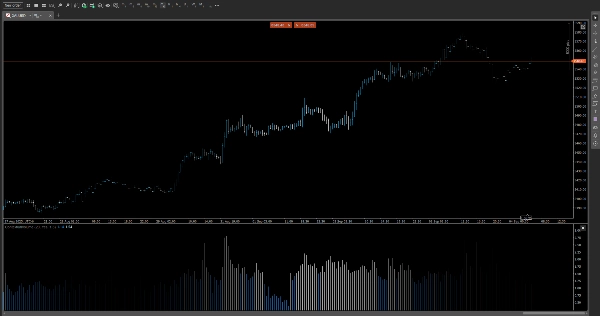
📊 Göreceli Hacim Gün İçi (RVI)
Önemli olan hacim artışlarını—önemli oldukları zamanda—belirleyin.
RVI, mevcut hacmi günün aynı saatindeki tarihsel ortalamasıyla karşılaştıran, gün içi oturumlar boyunca gizli momentum ve likidite değişimlerini ortaya çıkaran hassas bir göstergedir.
🔍 Temel Özellikler
• Günün Saatine Göre Hacim Profili
Önceki oturumlar boyunca her zaman dilimi (örneğin, 10:15) için ortalama hacmi hesaplar, her mum için bağlamsal bir kıyaslama sağlar.
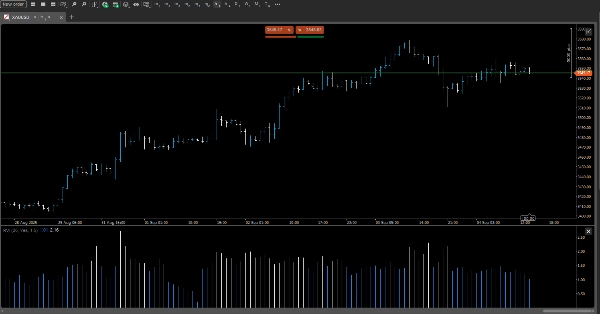
• Çoklu Zaman Dilimi Desteği
5 dakikalık grafiklerden 12 saatlik zaman dilimlerine kadar sorunsuz çalışır, scalping, swing veya oturum bazlı ticaret tarzınıza uyum sağlar.
• Dinamik Renk Kodlama
Özelleştirilebilir renk eşiklerini kullanarak ortalamanın üzerindeki hacme sahip mumları vurgular. Yüksek aktivite bölgelerini sezgisel görsel ipuçlarıyla anında fark edin.
• Oran ve Fark Modu
Tercih ettiğiniz metriği seçin:
• Oran Modu: Mevcut hacmi ÷ ortalama hacim olarak gösterir (örneğin, 2,3×)
• Fark Modu: Mutlak sapmayı gösterir (örneğin, +1.200 kontrat)
• Kaplama veya Panel Görünümü
Mevcut düzeninizle temiz entegrasyon için grafik üstü kaplamalar veya kompakt yan panel arasında geçiş yapın.
🎯 Kullanım Alanları
• Tipik aktiviteye göre hacim sıçramaları ile kırılma gücünü doğrulayın
• Düşük hacimli dönemlerde yanlış sinyalleri filtreleyin
• Önemli gün içi pencerelerde kurumsal izleri tanımlayın
• Zamana duyarlı bağlamla hacim tabanlı stratejileri geliştirin
⚙️ Özelleştirme Seçenekleri
• Tarihsel ortalama için ayarlanabilir geriye dönük dönem
• Hacim yoğunluğu için kullanıcı tanımlı renk eşikleri
• Görüntüleme modunu (Oran/Fark) değiştirin
• Karanlık/açık temalarla uyumlu
Özet
Müşteri değerlendirmeleri
5 | 100 % | |
4 | 0 % | |
3 | 0 % | |
2 | 0 % | |
1 | 0 % |


