Açıklama
📈 AutoFibRetracement Göstergesi
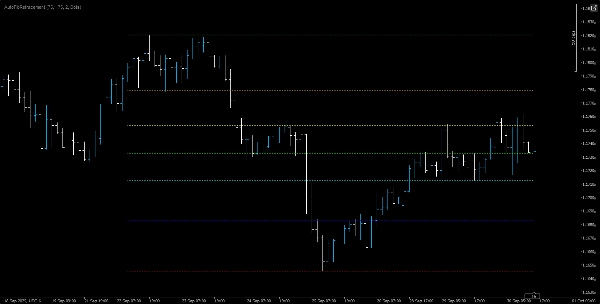
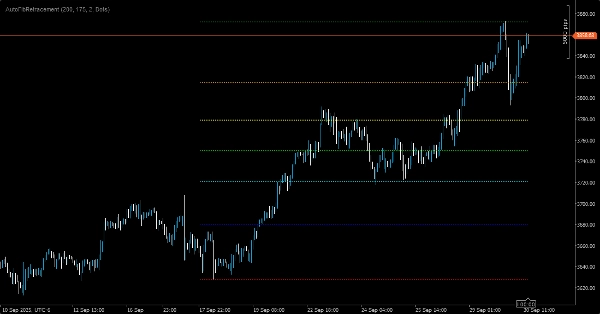
AutoFibRetracement göstergesi, son fiyat dalgalanmalarına dayalı olarak otomatik Fibonacci düzeltme seviyelerini çizmeye yönelik güçlü bir üst üste bindirme aracıdır. Potansiyel destek ve direnç bölgelerini belirlemek isteyen tüccarlar için idealdir, bu gösterge özelleştirilebilir parametreler kullanarak dinamik olarak düzeltme seviyelerini hesaplar ve bunları doğrudan grafik üzerinde gösterir.
🔧 Temel Özellikler:
• Otomatik Dalga Tespiti: Kullanıcı tarafından tanımlanan geri bakış penceresi içinde dalga yükseklerini ve düşüklerini hesaplar.
• Özelleştirilebilir Dönem Penceresi: Tüccarlar, anlamlı dalga yükseklerini ve düşüklerini doğru şekilde yakalamak için uygun bir pencere seçmelidir. Bu seçim, düzeltme seviyelerinin gerçek piyasa yapısıyla uyumlu olması için çok önemlidir.
• Fibonacci Seviyeleri: Standart oranları içerir — %0, %23.6, %38.2, %50, %61.8, %78.6 ve %100 — her biri görsel netlik için renk kodludur.
• Görsel Stil Seçenekleri:
• Çizgi saydamlığı için ayarlanabilir opaklık (0–255).
• Ayarlanabilir çizgi kalınlığı ve stili (örneğin, noktalı, düz).
• Üst Üste Bindirme Görüntüleme: Diğer teknik analiz araçlarıyla sorunsuz entegrasyon için fiyat grafiği üzerinde doğrudan çizer.
🎯 Kullanım Durumu:
Giriş, çıkış ve stop-loss seviyelerini planlamak için Fibonacci düzeltme bölgelerine güvenen dalga tüccarları, trend takipçileri ve teknik analistler için mükemmeldir. Bu göstergenin etkinliği, tüccarın doğru pencere boyutunu seçme yeteneğine bağlıdır — çok kısa olması daha geniş dalgaları kaçırabilir, çok uzun olması ise son fiyat hareketini seyreltebilir.