
Supertrend - Multi-Timeframe
Gösterge
1 satın almalar
Sürüm 1.0, Oct 2025
Windows, Mac
4.5
Değerlendirmeler: 2
Açıklama
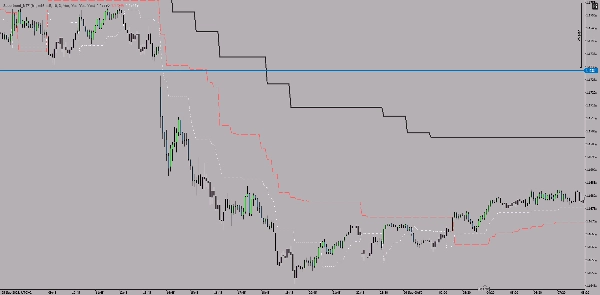
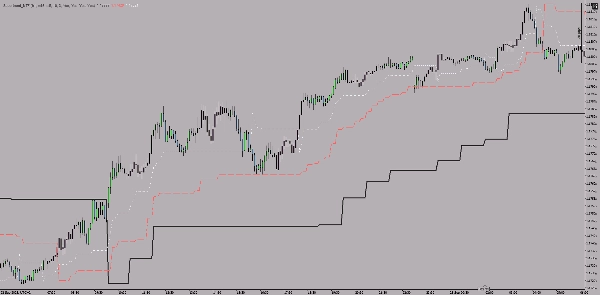
Bu, cTrader platformu için Çoklu Zaman Dilimi Supertrend göstergesidir ve tek bir grafikte üç farklı zaman diliminden Supertrend çizgilerini aynı anda gösterir.
Ana Özellikler
Üç Paralel Zaman Dilimi Görüntüleme:
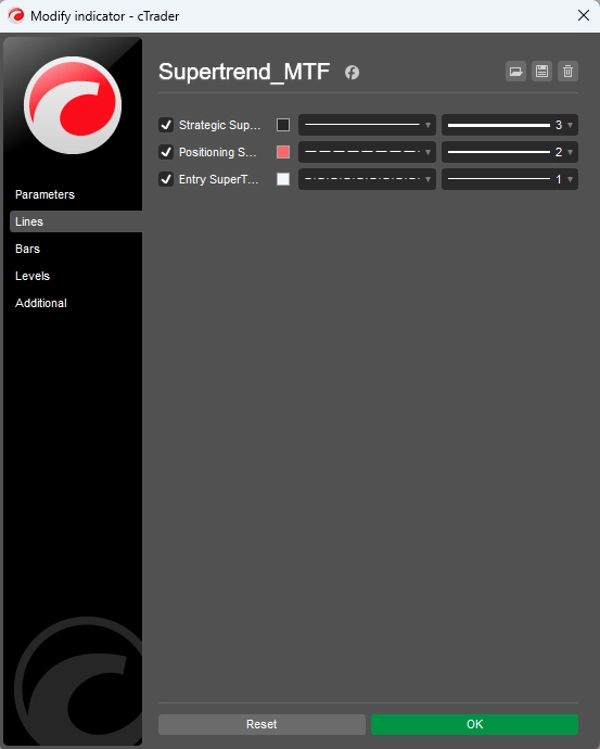
- Stratejik zaman dilimi (varsayılan: 1 saat) - kalın, düz çizgi
- Pozisyon zaman dilimi (varsayılan: 15 dakika) - orta kalınlıkta, kesikli çizgi
- Giriş zaman dilimi (varsayılan: 5 dakika) - ince, noktalı çizgi
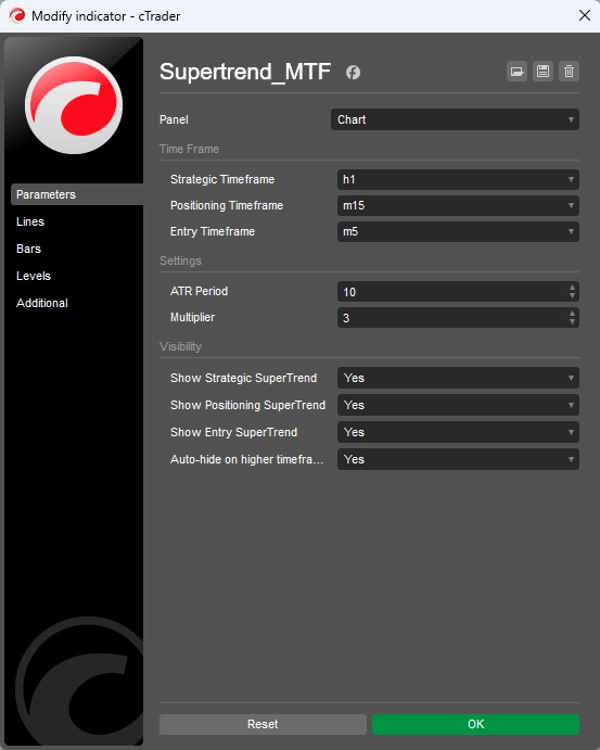
Özelleştirilebilir Ayarlar:
- ATR periyodu (varsayılan: 10)
- Çarpan (varsayılan: 3.0)
- Üç zaman diliminin her biri ayrı ayrı etkinleştirilebilir/devre dışı bırakılabilir
- Daha yüksek zaman dilimlerinde otomatik gizleme (isteğe bağlı)
Nasıl Çalışır
Gösterge, tüm üç zaman dilimi için klasik Supertrend mantığını kullanır, burada:
- Fiyat Supertrend çizgisinin üzerindeyse trend yukarıdadır
- Fiyat Supertrend çizgisinin altındaysa trend aşağıdadır
- Farklı çizgi kalınlıkları ve stilleri zaman dilimlerini ayırt etmeye yardımcı olur
Amaç
Çoklu zaman dilimi analizine yardımcı olur: daha büyük zaman dilimi ana yönü (stratejiyi) sağlar, orta olan pozisyonlamayı iyileştirir ve en küçük olan belirli giriş noktalarını işaretler.
Özet
YZ özeti
The Supertrend - Multi-Timeframe Indicator for the cTrader platform displays Supertrend lines from three distinct timeframes simultaneously on a single chart. It features a strategic timeframe (default 1 hour) shown as a thick solid line, a positioning timeframe (default 15 minutes) as a medium dashed line, and an entry timeframe (default 5 minutes) as a thin dotted line. Each timeframe can be individually enabled or disabled, with customizable settings including ATR period and multiplier. The indicator applies classic Supertrend logic: the trend is considered up when the price is above the Supertrend line and down when below. Different line styles and thicknesses visually distinguish the timeframes. This tool supports multi-timeframe analysis by providing the main directional trend from the larger timeframe, refined positioning from the middle timeframe, and specific entry points from the smallest timeframe. It is applicable across various markets including Forex, indices, commodities, stocks, and cryptocurrencies, and supports symbols such as BTCUSD, EURUSD, GBPUSD, XAUUSD, NAS100, and USDJPY.
Gösterge profili
Müşteri değerlendirmeleri
4.5
Değerlendirmeler: 2
5 | 50 % | |
4 | 50 % | |
3 | 0 % | |
2 | 0 % | |
1 | 0 % |
Müşteri değerlendirmeleri
October 13, 2025
The part worth keeping is the setup needs a cleaner reason to exist, and a few ugly trades are useful in the sample.
October 10, 2025
Tartışma
SSS
BTCUSD
Forex
Breakout
Indices
EURUSD
Commodities
GBPUSD
NZDUSD
Prop
Scalping
Crypto
Stocks
XAUUSD
NAS100
USDJPY
cTrader Store üzerinden erişilebilen işlem botları, göstergeler ve eklentiler gibi ürünler, üçüncü taraf sağlayıcılar tarafından sağlanır ve yalnızca bilgilendirme ve teknik erişim amaçlarıyla sunulur. cTrader Store bir broker değildir ve yatırım tavsiyesi, kişisel öneriler vermez veya gelecekteki performansı garanti etmez.


Fiyat
Başlangıç 05/01/2025
14
Satışlar