
คำอธิบาย
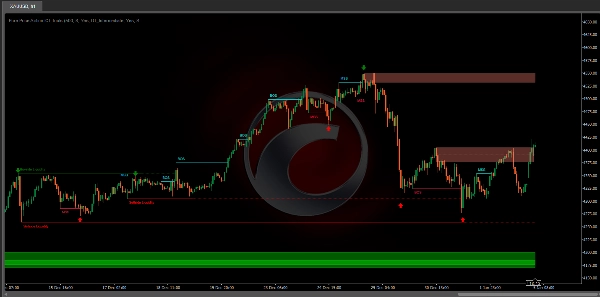
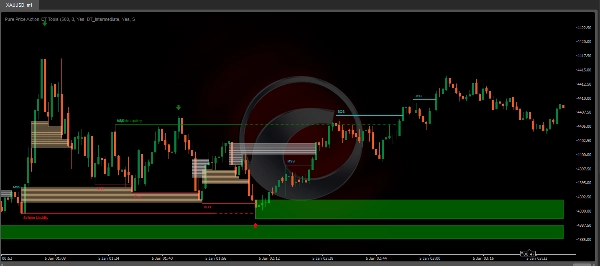
ตัวชี้วัด Pure Price Action ICT Tools ถูกออกแบบมาสำหรับการวิเคราะห์ pure price action โดยอัตโนมัติระบุโครงสร้างตลาดแบบเรียลไทม์ ระดับสภาพคล่อง บล็อกคำสั่ง & breaker และช่องว่างสภาพคล่อง
คุณสมบัติพิเศษของมันอยู่ที่การพึ่งพารูปแบบราคาอย่างเดียวโดยไม่ถูกจำกัดด้วยอินพุตที่ผู้ใช้กำหนด ทำให้มั่นใจได้ถึงการวิเคราะห์ที่แข็งแกร่งและเป็นวัตถุประสงค์ของพลวัตตลาด
คุณสมบัติหลัก
- โครงสร้างตลาด
การเปลี่ยนแปลงโครงสร้างตลาด หรือที่รู้จักกันในชื่อ Change of Character (CHoCH) เป็นเหตุการณ์สำคัญในการวิเคราะห์ price action ที่บ่งชี้ถึงการเปลี่ยนแปลงที่อาจเกิดขึ้นในความรู้สึกหรือทิศทางของตลาด MSS เกิดขึ้นเมื่อราคากลับตัวจากแนวโน้มที่กำหนดไว้ สัญญาณว่าแนวโน้มที่มีอยู่กำลังสูญเสียแรงขับเคลื่อนและอาจเกิดการกลับตัว การเปลี่ยนแปลงนี้มักถูกระบุโดยรูปแบบทางเทคนิคสำคัญ เช่น จุดต่ำที่สูงขึ้นในแนวโน้มขาลง หรือจุดสูงที่ต่ำลงในแนวโน้มขาขึ้น ซึ่งบ่งชี้ถึงความอ่อนแอของแรงแนวโน้มปัจจุบัน
การ Break of Structure มักบ่งชี้ถึงการดำเนินต่อของแนวโน้มตลาดปัจจุบัน เหตุการณ์นี้เกิดขึ้นเมื่อราคาขยับอย่างเด็ดขาดเกินกว่าจุดสูงสุดหรือต่ำสุดก่อนหน้า ยืนยันความแข็งแกร่งของแนวโน้มที่มีอยู่ ในแนวโน้มขาขึ้น BOS จะถูกทำเครื่องหมายโดยราคาที่ทะลุจุดสูงสุดก่อนหน้า ขณะที่ในแนวโน้มขาลง จะถูกระบุโดยราคาที่ทะลุต่ำสุดก่อนหน้า
แม้ว่า Market Structure Shift (MSS) จะบ่งชี้ถึงการกลับตัวของแนวโน้มที่อาจเกิดขึ้น และ Break of Structure (BOS) มักยืนยันการดำเนินต่อของแนวโน้ม แต่ทั้งสองไม่ได้รับประกันการกลับตัวหรือดำเนินต่ออย่างสมบูรณ์ ระดับ MSS และ BOS ยังสามารถทำหน้าที่เป็นโซนสภาพคล่องหรือพื้นที่รวมตัวของราคาแทนที่จะเป็นสัญญาณที่ชัดเจนของการเปลี่ยนทิศทางตลาด ผู้ค้า ควรใช้ความระมัดระวังกับสัญญาณเหล่านี้และตรวจสอบด้วยปัจจัยเพิ่มเติมก่อนตัดสินใจซื้อขาย สำหรับรายละเอียดเพิ่มเติมเกี่ยวกับส่วนประกอบอื่น ๆ ของเครื่องมือ กรุณาอ้างอิงส่วนถัดไป
- Order & Breaker Blocks
Order และ Breaker Blocks เป็นแนวคิดสำคัญในการวิเคราะห์ price action ที่ช่วยให้ผู้ค้าระบุระดับสำคัญในโครงสร้างตลาด
Order Blocks คือโซนราคาที่เฉพาะเจาะจงซึ่งมีกิจกรรมซื้อหรือขายที่สำคัญเกิดขึ้น โซนเหล่านี้มักแสดงถึงการกระทำของผู้ค้าสถาบันขนาดใหญ่หรือผู้สร้างตลาดที่ดำเนินคำสั่งจำนวนมากซึ่งส่งผลต่อตลาด
Breaker Blocks คือโซนราคาที่เฉพาะเจาะจงซึ่งเกิดการกลับตัวอย่างรุนแรง ทำให้เกิดการแตกหักในโครงสร้างตลาดที่มีอยู่ บล็อกเหล่านี้บ่งชี้ถึงพื้นที่ที่ราคาพบกับแรงต้านหรือแรงสนับสนุนที่สำคัญ นำไปสู่การกลับตัว
โดยสรุป สภาพคล่องฝั่งซื้อและฝั่งขายให้ข้อมูลเชิงลึกที่สำคัญเกี่ยวกับพลวัตอุปสงค์และอุปทานในตลาด ช่วยให้ผู้ค้าตัดสินใจอย่างมีข้อมูลโดยอิงจากความพร้อมของคำสั่งในระดับราคาต่าง ๆ
- Buyside & Sellside Liquidity
ทั้งโซนสภาพคล่องฝั่งซื้อและฝั่งขายมีความสำคัญต่อการระบุจุดกลับตัวที่อาจเกิดขึ้นในตลาด โซนเหล่านี้เป็นที่รวมตัวของความสนใจซื้อหรือขายที่สำคัญ ซึ่งมีอิทธิพลต่อการเคลื่อนไหวของราคาในอนาคต
โดยสรุป สภาพคล่องฝั่งซื้อและฝั่งขายให้ข้อมูลเชิงลึกที่สำคัญเกี่ยวกับพลวัตอุปสงค์และอุปทานในตลาด ช่วยให้ผู้ค้าตัดสินใจอย่างมีข้อมูลโดยอิงจากความพร้อมของคำสั่งในระดับราคาต่าง ๆ
- Liquidity Voids
Liquidity voids คือช่องว่างหรือพื้นที่บนแผนภูมิราคาที่ขาดกิจกรรมการซื้อขาย ช่องว่างเหล่านี้แสดงถึงโซนที่มีคำสั่งซื้อหรือขายน้อยมากหรือไม่มีเลย ซึ่งมักส่งผลให้เกิดการเคลื่อนไหวของราคาที่รวดเร็วเมื่อตลาดเข้าสู่พื้นที่เหล่านี้
โดยสรุป ช่องว่างสภาพคล่องเป็นพื้นที่สำคัญบนแผนภูมิราคาที่มีลักษณะขาดกิจกรรมการซื้อขาย ช่องว่างเหล่านี้สามารถนำไปสู่การเคลื่อนไหวของราคาที่รวดเร็วและความผันผวนที่เพิ่มขึ้น ทำให้เป็นปัจจัยที่สำคัญสำหรับผู้ค้าในการวิเคราะห์และตัดสินใจ
- Swing Points
จุดกลับตัวของราคาเรียกกันโดยทั่วไปว่า swing points ผู้ค้ามักวิเคราะห์ swing points ในอดีตเพื่อแยกแนวโน้มตลาดและระบุจุดเข้าและออกจากการซื้อขายที่เป็นไปได้
โปรดทราบว่าในสคริปต์นี้จุดเหล่านี้อาจถูกวาดย้อนหลัง กล่าวคือไม่ได้อยู่ในตำแหน่งที่ตรวจพบ
การตรวจจับ swing points และคุณสมบัติพิเศษของสคริปต์นี้ขึ้นอยู่กับ price action เท่านั้น โดยไม่ต้องใช้การตั้งค่าตัวเลขที่ผู้ใช้กำหนด กระบวนการเริ่มต้นด้วยการตรวจจับ swing points ระยะสั้น:
- Short-Term Swing High (STH): ระบุเป็นจุดสูงสุดของราคาโดยมีจุดสูงสุดที่ต่ำกว่าทั้งสองข้าง
- Short-Term Swing Low (STL): ระบุเป็นจุดต่ำสุดของราคาที่ล้อมรอบด้วยจุดต่ำสุดที่สูงกว่าทั้งสองข้าง
จุด swing ระยะกลางและระยะยาวถูกตรวจจับโดยใช้วิธีเดียวกันแต่มีการปรับเปลี่ยนเล็กน้อย แทนที่จะวิเคราะห์แท่งเทียนราคาโดยตรง จะใช้ swing points ระยะสั้นที่ตรวจจับก่อนหน้า สำหรับจุด swing ระยะกลางจะวิเคราะห์ swing points ระยะสั้น ขณะที่สำหรับจุด swing ระยะยาวจะใช้จุดระยะกลาง
วิธีนี้ช่วยให้การวิเคราะห์พลวัตตลาดมีความแข็งแกร่งและเป็นวัตถุประสงค์ โดยให้ข้อมูลเชิงลึกที่เชื่อถือได้แก่ผู้ค้า จุด swing ที่ตรวจจับได้เป็นพื้นฐานสำหรับการระบุโครงสร้างตลาด ระดับสภาพคล่องฝั่งซื้อ/ฝั่งขาย และบล็อกคำสั่งและ breaker ที่นำเสนอในเครื่องมือนี้
โดยสรุป จุด swing เป็นองค์ประกอบสำคัญในการวิเคราะห์ทางเทคนิค ช่วยให้ผู้ค้าระบุแนวโน้ม ระดับแนวรับและแนวต้าน และจุดเข้าออกที่เหมาะสม การเข้าใจจุด swing ช่วยให้ผู้ค้าตัดสินใจอย่างมีข้อมูลโดยอิงจากการเคลื่อนไหวตามธรรมชาติของราคาในตลาด
การตั้งค่า
- โครงสร้างตลาด
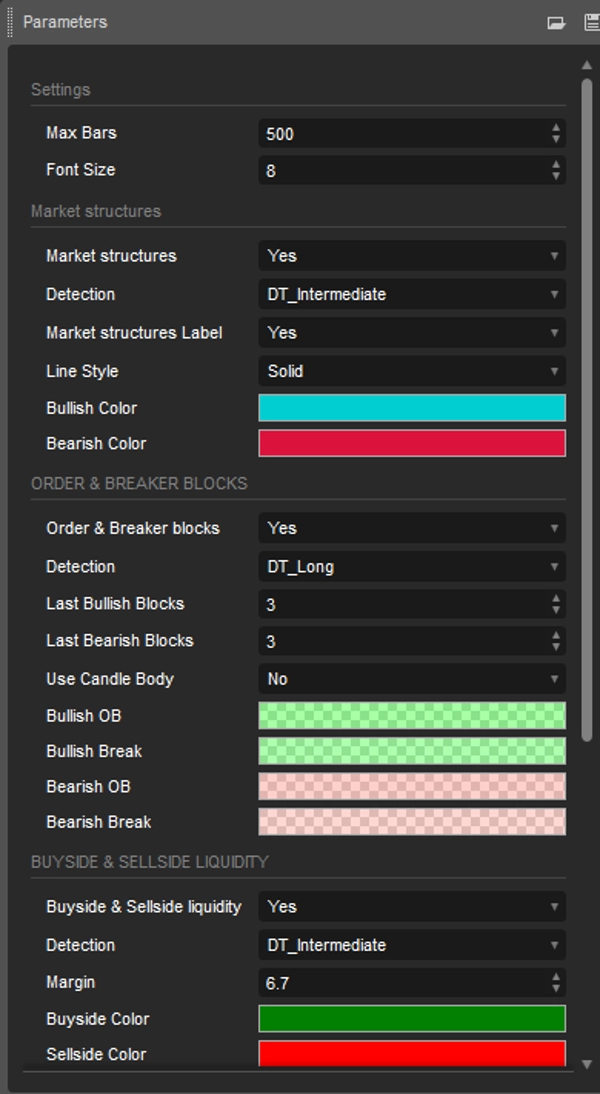
โครงสร้างตลาด: สลับการแสดงผลของโครงสร้างตลาด ทั้งการเปลี่ยนแปลงและการแตกหัก
การตรวจจับ: ตัวเลือกที่อนุญาตให้ผู้ใช้ตรวจจับโครงสร้างตลาดโดยอิงจากความสำคัญของระดับ swing รวมถึงระยะสั้น ระยะกลาง และระยะยาว
ป้ายโครงสร้างตลาด: ควบคุมการแสดงป้ายที่เน้นประเภทของโครงสร้างตลาด
สไตล์เส้น: ปรับแต่งสไตล์ของเส้นที่แทนโครงสร้างตลาด
- Order & Breaker Blocks
Order & Breaker Blocks: สลับการแสดงบล็อกคำสั่งและ breaker
การตรวจจับ: ตัวเลือกที่อนุญาตให้ผู้ใช้ตรวจจับบล็อกคำสั่งและ breaker โดยอิงจากความสำคัญของระดับ swing รวมถึงระยะสั้น ระยะกลาง และระยะยาว
บล็อกกระทิงล่าสุด: จำนวนบล็อกคำสั่ง/breaker กระทิงล่าสุดที่จะแสดงบนแผนภูมิ
บล็อกหมีล่าสุด: จำนวนบล็อกคำสั่ง/breaker หมีล่าสุดที่จะแสดงบนแผนภูมิ
ใช้ตัวแทนเทียน: อนุญาตให้ผู้ใช้ใช้ตัวแทนเทียนเป็นพื้นที่บล็อกคำสั่งแทนช่วงเต็มของเทียน
- Buyside & Sellside Liquidity
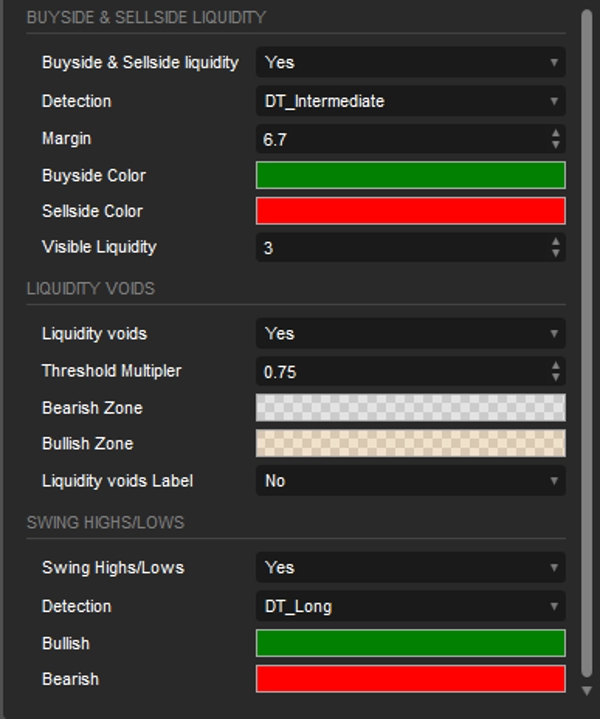
Buyside & Sellside Liquidity: สลับการแสดงระดับสภาพคล่องฝั่งซื้อและฝั่งขาย
การตรวจจับ: ตัวเลือกที่อนุญาตให้ผู้ใช้ตรวจจับสภาพคล่องฝั่งซื้อและฝั่งขายโดยอิงจากความสำคัญของระดับ swing รวมถึงระยะสั้น ระยะกลาง และระยะยาว
มาร์จิ้น: ตั้งค่ามาร์จิ้น/ความไวสำหรับการตรวจจับระดับสภาพคล่อง
สภาพคล่องที่มองเห็นได้: ควบคุมปริมาณของระดับ/โซนสภาพคล่องที่จะถูกแสดง
- Liquidity Voids
Liquidity Voids: เปิดใช้งานการแสดงทั้งช่องว่างสภาพคล่องกระทิงและหมี
ตัวคูณเกณฑ์: กำหนดตัวคูณสำหรับเกณฑ์ ซึ่งถูกตั้งค่าคงที่ที่ช่วง ATR 200 ระยะเวลา
ป้าย: เปิดใช้งานการแสดงป้ายที่บ่งชี้ช่องว่างสภาพคล่อง
- Swing Points
Swing Highs/Lows: สลับการแสดงระดับ swing
การตรวจจับ: ตัวเลือกที่อนุญาตให้ผู้ใช้ตรวจจับระดับ swing โดยอิงจากความสำคัญของระดับ swing รวมถึงระยะสั้น ระยะกลาง และระยะยาว
สรุป
Key functionalities include:
- Market Structures: Detects Market Structure Shifts (potential trend reversals) and Breaks of Structure (trend continuations) based on price patterns.
- Order & Breaker Blocks: Highlights significant price zones where institutional buying/selling or strong reversals occur.
- Buy-side & Sell-side Liquidity: Identifies zones of concentrated buying or selling interest that may influence price movements.
- Liquidity Voids: Marks price chart gaps with minimal trading activity, often leading to sharp price moves.
- Swing Points: Detects short-, intermediate-, and long-term reversal points to aid in trend analysis and trade decision-making.
The tool offers customizable settings to toggle visibility and detection sensitivity for each feature, including options to adjust detection based on swing level significance and display preferences. It supports analysis across various markets such as Forex, Crypto (e.g., BTCUSD), and indices (e.g., NAS100, XAUUSD). The indicator provides an objective framework for analyzing market dynamics based solely on price action patterns.
รีวิวจากลูกค้า
5 | 67 % | |
4 | 0 % | |
3 | 33 % | |
2 | 0 % | |
1 | 0 % |


