
Liquidity Cluster Order
อินดิเคเตอร์
2 การซื้อ
เวอร์ชัน 1.0, Nov 2025
Windows, Mac
5.0
รีวิว: 1
คำอธิบาย
คำสั่งกลุ่มสภาพคล่อง (LCO) 🔍💧
1. LCO แสดงอะไร
คำสั่งกลุ่มสภาพคล่อง ตรวจจับและวาดโดยอัตโนมัติ:
- กลุ่มสภาพคล่องขาขึ้น (โซนความต้องการ / การสะสมที่เป็นไปได้) ✅
- กลุ่มสภาพคล่องขาลง (โซนอุปทาน / การกระจายที่เป็นไปได้) 🔻
แต่ละกลุ่มคือ:
- ยึดติดกับ แท่งปริมาณพีโวท (ปริมาณสูงสุดในท้องถิ่น),
- จัดประเภทเป็น ขาขึ้น หรือ ขาลง ตามการขยายราคาล่าสุด,
- ขยาย ไปข้างหน้าในเวลา จนกว่าราคาจะ บรรเทา (บริโภค) กลุ่มนั้น.
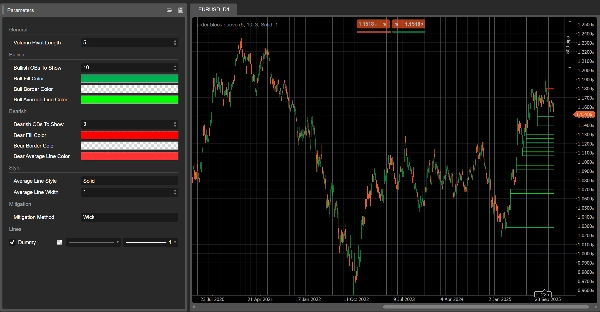
บนแผนภูมิคุณจะเห็น:
- สี่เหลี่ยมสีเขียว → กลุ่มสภาพคล่องขาขึ้น
- สี่เหลี่ยมสีแดง → กลุ่มสภาพคล่องขาลง
- เส้นสี เทา ภายในแต่ละสี่เหลี่ยม → ระดับราคากลาง ของกลุ่มนั้น
เมื่อกลุ่มถูกพิจารณาว่า บรรเทา มันจะหายไปจากแผนภูมิและเหลือเพียงกลุ่มที่ยังใช้งานอยู่เท่านั้น.
2. ตรรกะการตรวจจับ (ในคำง่ายๆ)
- ปริมาณพีโวท
-
- LCO สแกนหาแท่งที่ ปริมาณสูงกว่า แท่งก่อนหน้าและถัดไปตาม
Volume Pivot Length. - แท่งเหล่านี้คือ ปริมาณพีโวท – จุดยึดที่เป็นไปได้สำหรับกลุ่มสภาพคล่อง.
- LCO สแกนหาแท่งที่ ปริมาณสูงกว่า แท่งก่อนหน้าและถัดไปตาม
- บริบท: ขาขึ้น กับ ขาลง
-
- พฤติกรรมราคาล่าสุดกำหนด บริบท:
-
- บริบทขาขึ้น → การขยายลงมีอิทธิพล.
- บริบทขาลง → การขยายขึ้นมีอิทธิพล.
- บริบทนี้ตัดสินว่าปริมาณพีโวทถัดไปจะสร้าง กลุ่มขาขึ้น หรือ กลุ่มขาลง.
- กลุ่มสภาพคล่องขาขึ้น
ใน บริบทขาขึ้น: -
- ก้นกลุ่ม = ราคาต่ำของแท่งพีโวท
- ยอดกลุ่ม = จุดกึ่งกลางของแท่ง (
(สูง + ต่ำ) / 2) - การตีความ: โซนที่ แรงกดดันขาลงถูกดูดซับ และผู้ซื้อเข้ามาอย่างแข็งขัน.
- กลุ่มสภาพคล่องขาลง
ใน บริบทขาลง: -
- ก้นกลุ่ม = จุดกึ่งกลางของแท่งพีโวท
- ยอดกลุ่ม = ราคาสูงของแท่งพีโวท
- การตีความ: โซนที่ แรงกดดันขาขึ้นถูกดูดซับ และผู้ขายควบคุม.
- เส้นเฉลี่ย
-
- สำหรับแต่ละกลุ่ม LCO คำนวณค่าเฉลี่ยของยอดและก้นกลุ่มและวาด เส้นกลางสีเทา.
- เส้นนี้ทำหน้าที่เป็น ระดับสมดุลภายใน ของกลุ่ม.
- การบรรเทา (การบริโภคกลุ่ม)
ในแต่ละแท่งใหม่ LCO ตรวจสอบว่ากลุ่มถูก บรรเทา หรือไม่: -
- สำหรับ กลุ่มขาขึ้น:
-
- มันติดตาม ราคาตั้งเป้าลง ในช่วง
Volume Pivot Lengthแท่งล่าสุด: -
Mitigation Method = Wick→ ต่ำสุดของ ราคาต่ำ.Mitigation Method = Close→ ต่ำสุดของ ราคาปิด.
- ถ้าราคาตั้งเป้านี้ต่ำกว่า ก้นกลุ่ม กลุ่มขาขึ้นจะถูกพิจารณาว่า บรรเทา และถูกลบออก.
- มันติดตาม ราคาตั้งเป้าลง ในช่วง
- สำหรับ กลุ่มขาลง:
-
- มันติดตาม ราคาตั้งเป้าขึ้น:
-
Wick→ สูงสุดของ ราคาสูง.Close→ สูงสุดของ ราคาปิด.
- ถ้าราคาตั้งเป้านี้สูงกว่า ยอดกลุ่ม กลุ่มขาลงจะถูก บรรเทา และถูกลบออก.
บรรเทา = สภาพคล่องในกลุ่มนั้นถือว่า ถูกบริโภค / เป็นโมฆะ.
3. วิธีอ่าน LCO บนแผนภูมิ
คุณจะเห็นหลักๆ:
- กลุ่มสีเขียวใต้ราคา → โซน สภาพคล่องความต้องการ ที่เป็นไปได้
- กลุ่มสีแดงเหนือราคา → โซน สภาพคล่องอุปทาน ที่เป็นไปได้
การอ่านทั่วไป (ไม่ใช่คำแนะนำการเทรด):
- กลุ่มใหม่
-
- กลุ่มที่สร้างขึ้นใหม่มักจะเกี่ยวข้องมากกว่า:
-
- กลุ่มขาขึ้นใต้ราคา → พื้นที่ที่ผู้ซื้อดูดซับแรงกดดันขายล่าสุด.
- กลุ่มขาลงเหนือราคา → พื้นที่ที่ผู้ขายดูดซับแรงกดดันซื้อล่าสุด.
- การทดสอบซ้ำของกลุ่ม
-
- ราคากลับไปที่ กลุ่มขาขึ้นจากด้านบน:
-
- ถ้าราคาตอบสนองและยึดก้นกลุ่ม → เป็นไปได้ว่าเป็น โซนดีดตัว / การตอบสนองระยะยาว.
- ราคากลับไปที่ กลุ่มขาลงจากด้านล่าง:
-
- ถ้าราคาล้มเหลวในการเทรดเหนือยอดกลุ่ม → เป็นไปได้ว่าเป็น โซนปฏิเสธ / การตอบสนองระยะสั้น.
- กลุ่มที่บรรเทาแล้วกับกลุ่มที่ยังใช้งาน
-
- เมื่อราคาผ่าน กลุ่มเกินขอบเขตตามวิธีการบรรเทาที่เลือก,
→ กลุ่มสภาพคล่องนั้นจะ ถูกลบออก ในแท่งถัดไป. - กลุ่มที่ยังเห็นได้คือ โซนสภาพคล่องที่ยังใช้งานอยู่ ที่ยังไม่ถูกเทรดผ่านทั้งหมด.
- เมื่อราคาผ่าน กลุ่มเกินขอบเขตตามวิธีการบรรเทาที่เลือก,
- การใช้เส้นกลาง
-
- เส้นกลางสีเทานั้นสามารถใช้เป็น:
-
- ระดับการทำกำไรหรือการออกบางส่วนภายในกลุ่ม,
- การอ้างอิง “ราคายุติธรรม” ภายในโซนสภาพคล่อง,
- วิธีดูอย่างรวดเร็วว่าราคากำลังเทรดใน ครึ่งบนหรือครึ่งล่าง ของกลุ่ม.
4. พารามิเตอร์ (ภาษาอังกฤษ)
Volume Pivot Length
- แท่งที่ใช้เพื่อ:
-
- ตรวจจับปริมาณพีโวท,
- คำนวณค่าขอบเขตและเป้าหมายการบรรเทา.
- ค่าน้อย → กลุ่มมากขึ้น, เสียงรบกวนมากขึ้น;
- ค่ามาก → กลุ่มน้อยลง, มีความสำคัญมากขึ้น.
จำนวนกลุ่มสภาพคล่องขาขึ้นที่จะแสดง
(เดิมคือ Bullish OBs To Show)
- จำนวนสูงสุดของ กลุ่มขาขึ้น ที่แสดงบนแผนภูมิ.
จำนวนกลุ่มสภาพคล่องขาลงที่จะแสดง
(เดิมคือ Bearish OBs To Show)
- จำนวนสูงสุดของ กลุ่มขาลง ที่แสดง.
สีเติมกลุ่มขาขึ้น / สีเติมกลุ่มขาลง
- สีเติมของกลุ่มขาขึ้น/ขาลง.
- คุณสามารถรวมค่าความโปร่งใส (alpha) ได้.
สีเส้นเฉลี่ยกลุ่มขาขึ้น/ขาลง
- สีของเส้นกลางภายในแต่ละกลุ่ม.
สไตล์เส้นเฉลี่ย
- สไตล์ภาพสำหรับเส้นกลาง:
"Solid","Dashed","Dotted".
ความกว้างเส้นเฉลี่ย
- ความหนาของเส้นกลาง.
วิธีการบรรเทา
"Wick"→ การบรรเทาตาม ไส้เทียนสูง/ต่ำ (ไวต่อการเปลี่ยนแปลงมากกว่า)."Close"→ การบรรเทาตาม ราคาปิด (ระมัดระวังมากกว่า).
สรุป
สรุปโดย AI
Liquidity Cluster Order (LCO) is a trading indicator that automatically identifies and visualizes key liquidity zones on price charts. It detects bullish liquidity clusters (potential demand or accumulation zones) and bearish liquidity clusters (potential supply or distribution zones) by anchoring each cluster on volume pivot bars—local volume maxima—and classifies them based on recent price extensions.
On the chart, bullish clusters appear as green rectangles below the price, indicating areas where buyers absorbed selling pressure. Bearish clusters are shown as red rectangles above the price, marking zones where sellers absorbed buying pressure. Each cluster includes a grey mid-line representing the average price level, serving as an internal equilibrium reference.
Clusters extend forward in time until price "mitigates" or consumes them, at which point they disappear, leaving only active liquidity zones visible. Mitigation is determined by tracking price extremes (high/low wicks or closing prices) over a configurable number of bars.
Key parameters include the volume pivot length (defining sensitivity and cluster significance), maximum clusters displayed, cluster colors, mid-line style, and mitigation method. LCO supports various markets including forex, indices, commodities, stocks, and cryptocurrencies, and integrates with multiple trading strategies and indicators such as RSI, MACD, Bollinger Bands, and Fibonacci levels.
โปรไฟล์อินดิเคเตอร์
รีวิวจากลูกค้า
5.0
รีวิว: 1
5 | 100 % | |
4 | 0 % | |
3 | 0 % | |
2 | 0 % | |
1 | 0 % |
รีวิวจากลูกค้า
November 18, 2025
Two timeframes give more context. The first signal should not decide the only input.
การสนทนา
คำถามที่พบบ่อย
Signal
Indices
Commodities
GBPUSD
RSI
Bollinger
Fibonacci
Scalping
AI
XAUUSD
NAS100
MACD
BTCUSD
Forex
Breakout
EURUSD
NZDUSD
Martingale
Prop
Supertrend
Fair Value Gap
SMC
Crypto
Grid
Stocks
ATR
USDJPY
VWAP
ผลิตภัณฑ์ที่มีให้บริการผ่าน cTrader Store รวมถึงบอทการเทรด อินดิเคเตอร์ และปลั๊กอิน มีให้บริการโดยนักพัฒนาบุคคลที่สามและมีไว้เพื่อวัตถุประสงค์ในการเข้าถึงข้อมูลและทางเทคนิคเท่านั้น cTrader Store ไม่ใช่โบรกเกอร์และไม่ได้ให้คำแนะนำการลงทุน คำแนะนำส่วนบุคคล หรือการรับประกันผลการดำเนินงานในอนาคต


ราคา
42.11M
ปริมาณการเทรด
6.13M
Pips ที่ได้กำไร
222
การขาย
8.39K
ติดตั้งฟรี