
คำอธิบาย
Marketplace Pitch (short)
Volume Delta & CVD — อ่านการไหลที่รุนแรงแบบเรียลไทม์ รีเซ็ตได้อย่างยืดหยุ่น (วัน/สัปดาห์/เดือน) พร้อม EMA smoothing ทางเลือก และเดลต้าสะสมที่ไม่ทาสีซ้ำ เหมาะสำหรับการยืนยันการเบรกเอาท์และการตรวจจับความแตกต่าง
Volume Delta & CVD — Review & Parameter Guide
Tagline: วัดความไม่สมดุลของการซื้อ/ขาย (Delta) และการไหลสะสม (CVD) ด้วยการรีเซ็ตที่ยืดหยุ่น ไม่ทาสีซ้ำ
ภาพรวม
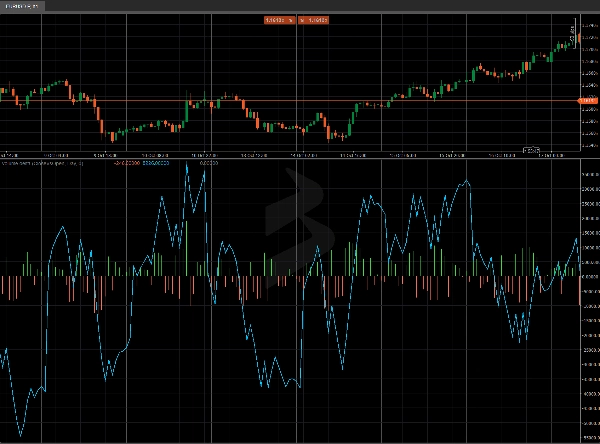
Volume Delta & CVD สำหรับ cTrader คำนวณต่อแท่ง Delta (การซื้อที่รุนแรงเทียบกับการขาย) และ CVD (Cumulative Volume Delta) ช่วยให้คุณอ่าน แรงกดดันของการไหลคำสั่ง ยืนยันการเบรกเอาท์ และตรวจจับ ความแตกต่าง กับราคา
หมายเหตุ: ตัวชี้วัดใช้ TickVolume (มาตรฐาน cTrader) เป็นตัวแทนปริมาณ
พารามิเตอร์ (รายละเอียด)
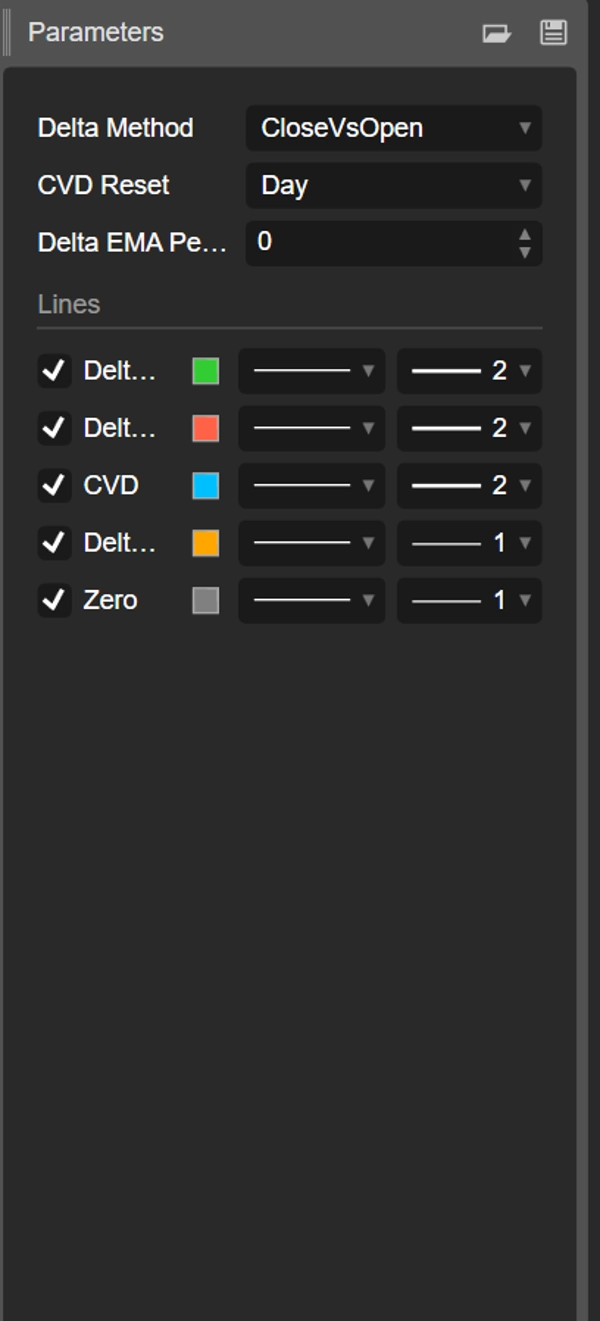
วิธี Delta
เลือกวิธีการประมาณการไหลทิศทางของแท่ง:
- CloseVsPrevClose
Delta = ±TickVolume ขึ้นอยู่กับ Close[t] เทียบกับ Close[t-1].
ข้อดี: ตอบสนองเร็วมาก เหมาะสำหรับการเปลี่ยนแปลงระบอบภายในวัน - CloseVsOpen
Delta = ±TickVolume ขึ้นอยู่กับ Close เทียบกับ Open ของ แท่งเดียวกัน.
ข้อดี: เน้นแท่งที่มีทิศทาง ลดเสียงรบกวนข้ามแท่ง - Money Flow Multiplier (MFM)
MFM = ((Close−Low) − (High−Close)) / (High−Low)ใน [−1, +1]
Delta = MFM × TickVolume
ข้อดี: การถ่วงน้ำหนักภายในแท่ง; นุ่มนวลและแข็งแรงเมื่อช่วงกว้าง
การรีเซ็ต CVD
ควบคุมเมื่อเคาน์เตอร์สะสมเริ่มใหม่:
- ไม่มี: ต่อเนื่องตั้งแต่เริ่มแผนภูมิ
- วัน: รีเซ็ตทุก วันใหม่ (แนวโน้มภายในวัน)
- สัปดาห์: รีเซ็ตทุก สัปดาห์ใหม่ (สวิง)
- เดือน: รีเซ็ตทุก เดือนใหม่ (แนวโน้มกรอบเวลาสูงกว่า)
ช่วงเวลา Delta EMA (0 = ปิด)
- ใช้ EMA กับ Delta เพื่อทำให้ฮิสโตแกรมเรียบและเผยให้เห็น การเปลี่ยนแปลงระบอบ.
- คำแนะนำ: 5–9 สำหรับการเก็งกำไรระยะสั้น, 10–21 ภายในวัน, 21–34 สวิง
ผลลัพธ์ / บัฟเฟอร์
- Delta Up (ฮิสโตแกรมสีเขียว): ส่วนบวกของ Delta
- Delta Down (ฮิสโตแกรมสีแดง): ส่วนลบของ Delta
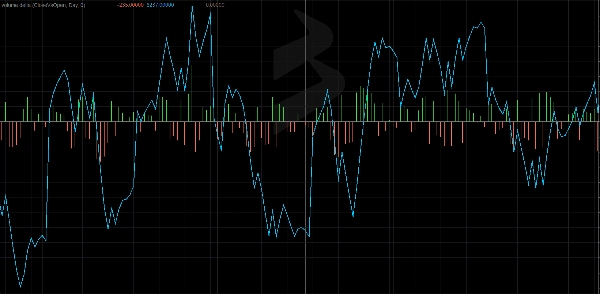
- CVD (เส้นสีฟ้า): ผลรวมสะสมของ Delta พร้อมการรีเซ็ตที่เลือก
- Delta EMA (เส้นสีส้ม ทางเลือก): Delta ที่เรียบ
- ศูนย์ (เส้นสีเทา): เส้นฐานสำหรับการเปรียบเทียบอย่างรวดเร็ว
วิธีอ่าน
- Delta > 0 → การซื้อที่รุนแรง มีอำนาจเหนือกว่า ในแท่ง
- Delta < 0 → การขายที่รุนแรง มีอำนาจเหนือกว่า ในแท่ง
- CVD ที่เพิ่มขึ้น → การสะสม; CVD ที่ลดลง → การกระจาย
- ความแตกต่าง
-
- ราคาทำ สูงสุดสูงขึ้น ขณะที่ CVD ไม่ยืนยัน → อาจเกิดการหมดแรงกดดันซื้อ
- ราคาทำ ต่ำสุดต่ำลง ขณะที่ CVD ไม่ยืนยัน → อาจเกิดการหมดแรงกดดันขาย
คู่มือการใช้งานจริง
- ยืนยันการเบรกเอาท์: ชอบเบรกเอาท์ยาวเมื่อ CVD เร่งความเร็ว และ Delta EMA กลับมาเป็นบวก
- การลดการขยาย: มองหาความแตกต่างระหว่าง ราคา กับ CVD ที่ระดับสำคัญ (VWAP/Anchored VWAP, S/R)
- แนวโน้มช่วงเวลา: ด้วย CVD Reset = Day อ่านทิศทางภายในวันที่โดดเด่น
เริ่มต้นอย่างรวดเร็ว
- แนบตัวชี้วัด
- เริ่มด้วย Delta Method = MFM, CVD Reset = Day, EMA = 10 (ภายในวัน)
- บนแผนภูมิที่มีเสียงรบกวน ให้เพิ่ม EMA หรือเปลี่ยนเป็น CloseVsOpen.
- ค้นหาความสอดคล้องกับ Anchored VWAP, S/R แบบคงที่/ไดนามิก หรือรูปแบบการเคลื่อนไหวของราคา
ประสิทธิภาพ & ความเข้ากันได้
- API สมัยใหม่ (
Bars.*,LineColor) - การคำนวณที่ไม่ทาสีซ้ำ
- ใช้งานได้กับ สัญลักษณ์และกรอบเวลาใดก็ได้.
สรุป
The indicator supports three Delta calculation methods: CloseVsPrevClose (responsive for intraday shifts), CloseVsOpen (reduces noise by focusing on directional bars), and Money Flow Multiplier (MFM) which weights intra-bar volume for smoother results. An optional Exponential Moving Average (EMA) smoothing can be applied to Delta to highlight regime changes.
Outputs include separate histograms for positive and negative Delta, the CVD line, an optional Delta EMA line, and a zero baseline for reference. Traders can use the indicator to confirm breakouts, identify divergences between price and volume flow, and assess order-flow pressure. It works on any symbol and timeframe, supporting markets such as Forex, indices, commodities, stocks, and cryptocurrencies.


!["[Hamster-Coder] Moving Average MTF" โลโก้](https://cdn.ctrader.com/image/webp/b11b98b1-194d-4b8e-b00e-d611826ad159_31226)


