
ORB Range with FVGs
Indikator
606 downloads
Version 1.0, Sep 2025
Windows, Mac
1.0
Bewertungen: 1
Beschreibung
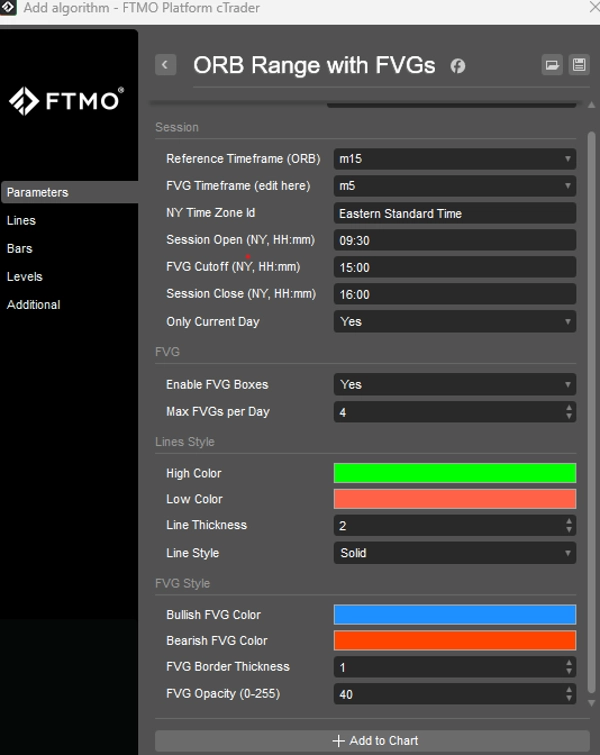
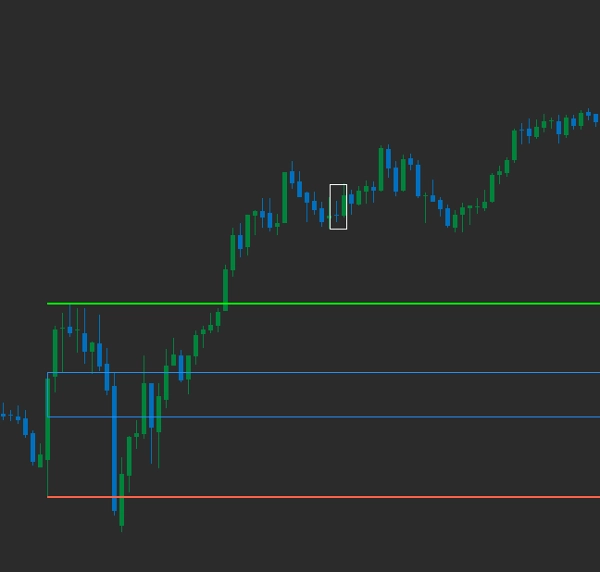
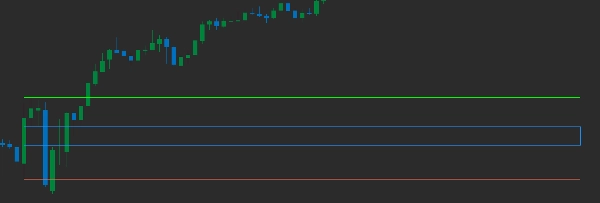
- Dieser Indikator zeichnet die 15-minütige Eröffnungsrange der NY-Session mit den ersten N FVGs, die nach der Eröffnung im Chart dargestellt werden
Der Benutzer kann:
Den Start und das Ende der ORB an andere Sessions anpassen.
Den Zeitrahmen der FVGs definieren, die dargestellt werden sollen.
Farben nach Ihren Vorlieben bearbeiten.
Beachten Sie, dass dies nur ein Indikator ist und nicht als finanzielle Beratung jeglicher Art gedacht ist.
Geben Sie mir Ihr Feedback für weitere Verbesserungen.
Danke
Zusammenfassung
KI-Zusammenfassung
The ORB Range with FVGs indicator plots the 15-minute opening range of the New York trading session on the chart, along with the first N Fair Value Gaps (FVGs) that appear after the session opens. Users can customize the indicator by adjusting the opening range start and end times to accommodate other trading sessions. Additionally, the timeframe for the FVGs displayed can be defined according to user preference. Color settings are also editable to match individual chart styles. This tool is designed to assist traders analyzing Forex, indices, and popular symbols such as EURUSD, GBPUSD, XAUUSD, NAS100, and USDJPY. It supports strategies including breakout and scalping by visually highlighting key price ranges and imbalances. The indicator serves as a visual aid and does not provide financial advice.
Indikatorprofil
Kundenbewertungen
1.0
Bewertungen: 1
5 | 0 % | |
4 | 0 % | |
3 | 0 % | |
2 | 0 % | |
1 | 100 % |
Diskussion
Häufig gestellte Fragen (FAQ)
Forex
Breakout
Scalping
Indices
EURUSD
GBPUSD
Fair Value Gap
XAUUSD
NAS100
USDJPY
Über den cTrader Store verfügbare Produkte, einschließlich Handelsbots, Indikatoren und Plugins, werden von externen Entwicklern bereitgestellt und nur zu Informations- und technischen Zugriffszwecken verfügbar gemacht. cTrader Store ist kein Broker und erbringt keine Anlageberatung, persönlichen Empfehlungen oder eine Garantie für zukünftige Performance.
Mehr von diesem Autor


Preis
Seit 30/01/2025
36.05M
Gehandeltes Volumen
26.73K
Pip-Gewinn
1.24K
Kostenlose Installationen