
Previous day Key Levels
지표
409 다운로드
버전 1.0, Oct 2025
Windows, Mac
4.0
리뷰: 1
설명
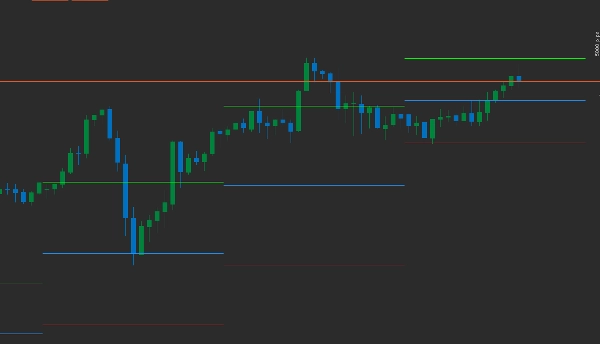
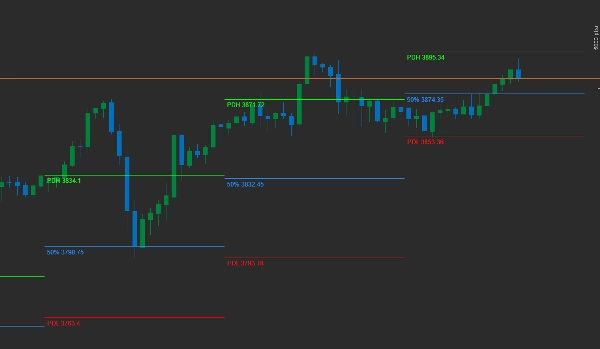
이 지표는 이전 날의 고가, 저가 및 50% 되돌림을 표시합니다.
사용자는 기록을 활성화/비활성화할 수 있습니다
기록이 활성화되면 볼 일수 선택이 가능합니다.
각 선의 색상을 변경하세요
각 선을 식별하는 레이블을 활성화/비활성화하세요
요약
AI 요약
The Previous Day Key Levels indicator plots the prior trading day's High, Low, and 50% retracement levels on the chart. Users can customize the display by enabling or disabling historical data and selecting the number of past days to view. The indicator allows color customization for each line and the option to show or hide labels identifying each level. It supports various markets and symbols including Forex pairs (EURUSD, GBPUSD, NZDUSD, USDJPY), cryptocurrencies (BTCUSD, crypto), commodities (XAUUSD, gold, oil, silver), indices (NAS100, Dow, S&P 500, DAX), and stocks. This tool is designed to assist traders in identifying key price levels from the previous day that may influence current market behavior.
지표 프로필
고객 리뷰
4.0
리뷰: 1
5 | 0 % | |
4 | 100 % | |
3 | 0 % | |
2 | 0 % | |
1 | 0 % |
고객 리뷰
December 1, 2025
Previous Day Key Levels marks yesterday’s High, Low, Open, Close and midpoint - clean, fast and reliable. Great for intraday structure, liquidity zones and reaction points. Lightweight and useful on any timeframe. Alerts and range-zone shading would make it even better.
상담
자주 묻는 질문(FAQ)
BTCUSD
Forex
Breakout
Indices
EURUSD
Commodities
GBPUSD
NZDUSD
Scalping
Crypto
Stocks
XAUUSD
NAS100
USDJPY
트레이딩 봇, 지표, 플러그인 등 cTrader Store에서 제공되는 상품은 제3자 개발자에 의해 제공되며, 이는 단순히 정보 및 기술적 접근을 목적으로 제공된 것입니다. cTrader Store는 중개인이 아니며, 투자 조언, 개인별 추천 또는 향후 성과에 대한 어떠한 보장도 제공하지 않습니다.
이 작성자의 상품 더 보기


좋아하실 만한 다른 항목


가격
가입일 30/01/2025
36.05M
거래량
26.73K
핍 수익
1.24K
무료 설치