
설명
시장 불균형 영역(공정 가치 갭 또는 FVG)을 식별하고 이를 차트에 스마트하게 표시합니다. 다른 지표와 달리 이 지표는 가격 움직임에 실시간으로 적응하여 크기, 지속성 및 관련성을 조정합니다. 명확한 목표와 고급 시각적 갭 관리를 원하는 트레이더에게 이상적입니다.
✨ 주요 기능
- 동적 갭 조정
논리: 가격이 FVG의 일부에만 닿으면(예: 하단 경계에 스치듯 닿을 경우) 지표가 자동으로 갭 크기를 덮이지 않은 영역만 반영하도록 조정합니다.
장점: 잘못된 신호를 피하고 실제 잠재력이 있는 갭만 활성 상태로 유지합니다. - 중간점 채움
논리: 갭 중앙에 선을 그립니다. 가격이 이 선에 닿으면 FVG가 "채워진" 것으로 간주되어 제거할 수 있습니다(설정 가능).
장점: 닫힘 확인에 50% 접촉만 필요하여 노이즈와 조기 거래를 필터링합니다. - 채워질 때까지 무한 투영
논리: 갭이 미래로 무한히 확장됩니다(특정 캔들 이후 사라지지 않음).
장점: 시장이 불균형을 해결할 때까지 지속적인 참조를 제공합니다. - 무효화된 갭 자동 정리
논리: 완전히 채워진 오래된 갭을 자동으로 제거합니다.
장점: 차트를 깔끔하게 유지하고 활성 영역에 집중할 수 있습니다. - 고급 시각적 사용자 지정
옵션: 강세(녹색)와 약세(빨간색) 갭에 대한 다양한 색상. 차트 혼잡을 피하기 위한 투명도 조절.
장점: 모든 거래 스타일이나 시각 전략에 적응합니다.
🎯 거래에 어떻게 사용하는가?
핵심 영역 식별:
- 강세 FVG(녹색): 매수자가 일시적으로 힘을 잃은 영역.
→ 전략: 이 영역으로의 되돌림 시 매수 기회를 찾습니다. - 약세 FVG(빨간색): 매도자가 밀린 영역.
→ 전략: 이 영역으로의 반등 시 매도 기회를 찾습니다.
가격과의 상호작용:
- 갭이 동적으로 조정(크기 축소)되면 시장이 영역을 테스트하지만 확인은 없음을 나타냅니다.
- 갭이 제거되면(완전 채움 또는 중간점에 의해) 불균형이 수정된 것으로 간주합니다.
🔍 다른 도구와의 확인
FVG를 지지/저항, 거래량 또는 RSI와 결합하여 신호를 필터링하세요.
📋 기능 비교
___________________________________________________________________________________
기능 모멘텀 공정 가치 갭 전통적 지표
________________________________________________________________________________
지속성---------------- 갭이 채워질 때까지 확장 ----------------------- X 캔들 후 사라짐
닫힘 정확도-------- 50% 확인 옵션 --------------------- 완전한 갭 채움 필요
유연성 ------------------ 가격에 따라 크기 조정 ------------------------- 고정되고 변경 불가한 수준
시각적 집중---------------- 관련 없는 갭 제거 ----------------------- 과거 데이터로 차트 혼잡
📝 실전 예시
EURUSD(1시간) 시나리오:
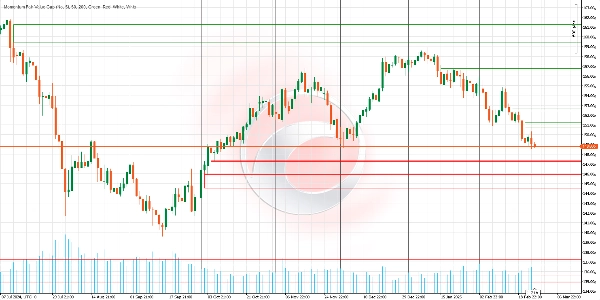
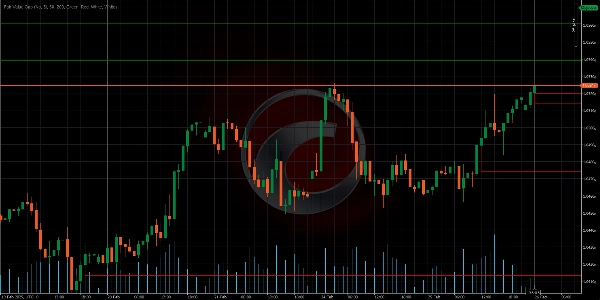
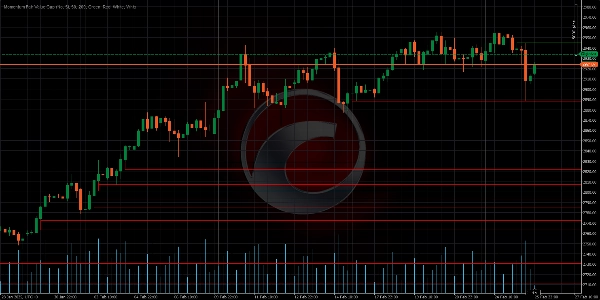
뚜렷한 약세 캔들 이후 강세 FVG(녹색)가 형성됩니다. 며칠 후 가격이 되돌림을 하며 갭의 하단 경계에 닿지만 채우지는 않습니다. 지표가 자동으로 갭 크기를 줄입니다. 마지막으로 가격이 중간점(중앙선)에 닿아 갭이 제거됩니다. 트레이더는 영역에서 거부를 확인한 후 숏 포지션을 취합니다.
Ctrader 스토어 지표:
요약
Key features include:
- Dynamic Gap Adjustment: Automatically resizes gaps when price partially touches them, reducing false signals.
- MidPoint Fill: Marks the gap centerline; if price touches it, the gap is considered filled and can be removed, requiring only 50% contact for confirmation.
- Infinite Projection: Gaps extend indefinitely until filled, maintaining persistent market imbalance references.
- Automatic Cleanup: Removes fully filled gaps to keep charts focused on active zones.
- Advanced Visual Customization: Uses distinct colors for bullish (green) and bearish (red) gaps with adjustable transparency.
In trading, bullish FVGs indicate zones where buyers lost strength, suggesting buying opportunities on pullbacks; bearish FVGs mark where sellers were overtaken, indicating selling opportunities on rallies. The indicator’s dynamic interaction with price helps confirm market imbalance resolution.
It is recommended to combine this indicator with other tools like support/resistance levels, volume, or RSI for signal filtering.
고객 리뷰
5 | 0 % | |
4 | 100 % | |
3 | 0 % | |
2 | 0 % | |
1 | 0 % |


