
Açıklama
NE YAPAR
Supertrend Hareketli Ortalama, geleneksel hareketli ortalamaların temel bir sınırlamasını ele alır: trendlerin gerçekte nasıl geliştiğine asla uyum sağlamayan sabit dönemler.
Kısa dönemler hızlı tepki verir ancak sık sık yanıltır. Uzun dönemler gürültüyü yumuşatır ancak güçlü hareketlerde kötü gecikir. Ayar ne olursa olsun, bir sayı tahmin etmek ve piyasanın işbirliği yapmasını ummak zorundasınız.
Bu gösterge o tahmin işini ortadan kaldırır.
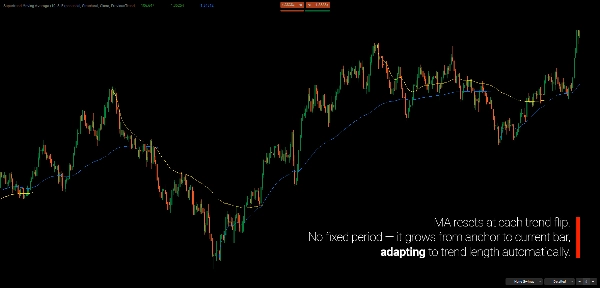
Fiyatı rastgele bir bar sayısı üzerinden ortalamak yerine, mevcut trendin yapısal olarak başladığı andan itibaren hareketli ortalamayı hesaplar. Trend ne kadar uzun sürerse, HO doğal olarak o kadar uzun olur. Kısa trendler duyarlı kalır. Uzun trendler otomatik olarak daha yumuşak hale gelir.
Sonuç, trendle birlikte büyüyen, ona karşı değil hareket eden bir hareketli ortalamadır.
Supertrend tabanlı yapısal değişikliklere bağlı olarak, bu HO piyasa ritmine gerçek zamanlı olarak uyum sağlar, optimizasyon, eğriye uyum veya manuel ayar gerektirmez. Yapı dönemi belirler — tüccar değil.
NEDEN YAPISAL SUPERTREND?
Orijinal Supertrend, fiyat bantının ötesinde kapanınca yön değiştirir. Bu temiz trendlerde iyi çalışır ancak dalgalı koşullarda yanlış sinyaller gibi yaygın bir hayal kırıklığı yaratır.
Sorun
Bantın biraz ötesinde kapanan tek bir volatil mum, geniş trend sağlam kalsa bile yön değişikliğini tetikler. Orijinal Supertrend'i takip eden tüccarlar genellikle şunları yaşar:
- Konsolidasyon sırasında yanıltıcı hareketler
- Geçerli trendlerden erken çıkışlar
- Yanlış dönüşlerden sonra daha kötü fiyatlarda yeniden girişler
Çözüm
Yapısal Supertrend, orijinal Supertrend kavramını, anlık volatilite yerine yapısal değişiklikleri daha iyi yansıtacak şekilde genişletir. Gerçek bir yön değişikliğinin gerçekleştiğine dair onay bekleyerek gürültüyü filtreler.
Sonuç, daha az yanlış yön değişikliği ve gerçek trend değişiklikleriyle daha iyi uyumdur.
Neden İkisini de Tutmalısınız?
Orijinal Supertrend işe yaramaz değil — farklı bir soruya cevap veriyor.
- Yapısal ana trendi gösterir ("büyük resim")
- Orijinal o trend içindeki momentum değişimlerini gösterir (impuls vs. düzeltme)
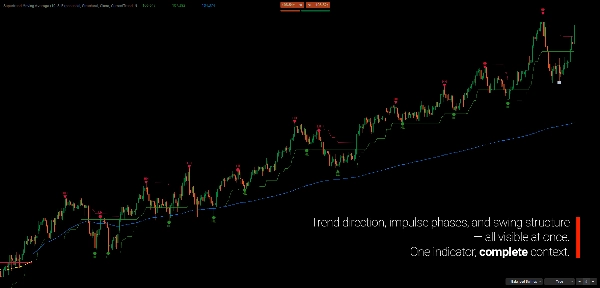
Her iki çizgi uyumlu olduğunda: güçlü yönelme. Farklılaştığında: hareket düzeltici olabilir, gerçek bir dönüş olmayabilir.
Bu çift katmanlı görünüm, tek başına hiçbir çizginin sağlayamadığı bağlamı size sunar.
TEMEL KAVRAM
Geleneksel HO'lar şu soruya cevap verir: "N bar boyunca ortalama fiyat nedir?"
Bu gösterge şu soruya cevap verir: "Mevcut trend başladığından beri ortalama fiyat nedir?"
HO doğrudan Supertrend üzerine inşa edilmiştir:
- Supertrend bir trend dönüşünü algılar
- Gösterge önceki trendin aşırı kapanışını bulur (yeni düşüş trendi için en yüksek, yeni yükseliş trendi için en düşük)
- HO o noktaya sabitlenir ve mevcut bara kadar hesaplanır
- Supertrend tekrar döndüğünde, HO yeni bir sabitlemeye sıfırlanır
Supertrend trendi tanımlar. HO ölçer. Bunlar ayrı araçlar değil, tek bir sistem olarak çalışır.
Hangi Supertrend'in HO'yu yönlendireceğini siz seçersiniz:
- Yapısal — daha az sıfırlama, ana trendi takip eder
- Orijinal — daha fazla sıfırlama, kısa vadeli momentumu takip eder
ANA ÖZELLİKLER
Çift Supertrend Analizi
- Yapısal Supertrend yapısal olarak uyarlanmış bir Supertrend modeli kullanarak ana trend yönünü belirler
- Orijinal Supertrend trend içindeki impuls ve düzeltici davranışı ortaya koyar
- Görsel karşılaştırma, her ikisi de aynı fikirde olduğunda (kesinlik) ve farklılaştığında (dikkat) gösterir
Uyarlanabilir Sabit Noktalı Hareketli Ortalama
- HO otomatik olarak önceki trendin aşırı kapanışına sabitlenir
- Dönem sabit ayar gerektirmeden sabit noktadan dinamik olarak büyür
- Üç HO türü: Basit, Üssel, Arnaud Legoux (ALMA)
- Anında yönelimi tanımak için trend yönüne göre renk kodlaması
Çoklu Zaman Dilimi Bağlamı
- HO hesaplamasını daha yüksek zaman dilimi Supertrend'ine uygulayın, alt zaman dilimi grafiklerini görüntülerken
- Zaman dilimi değiştirmeden H1 grafiğinizde Günlük trend HO'sunu görün
- Otomatik bar gereksinimi algılama ve net uyarılar
Entegre Salınım Algılama
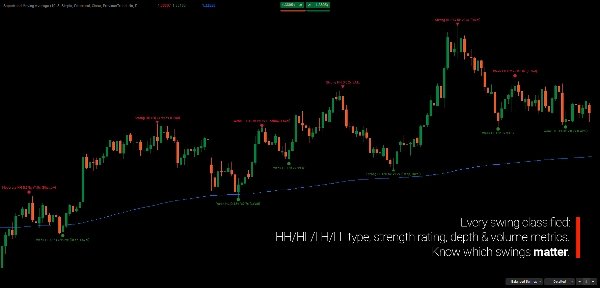
- Üç algılama modu: Minör, Dengeli, Majör
- Salınım gücü sınıflandırması (Zayıf, Orta, Güçlü)
- HH/HL/LH/LL etiketleri trend yapısını doğrular
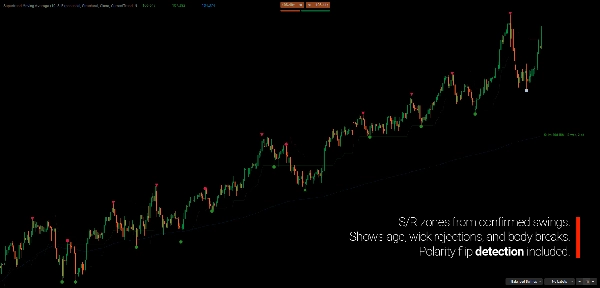
- Opsiyonel S/R bölgeleri ve polarite değişimi takibi
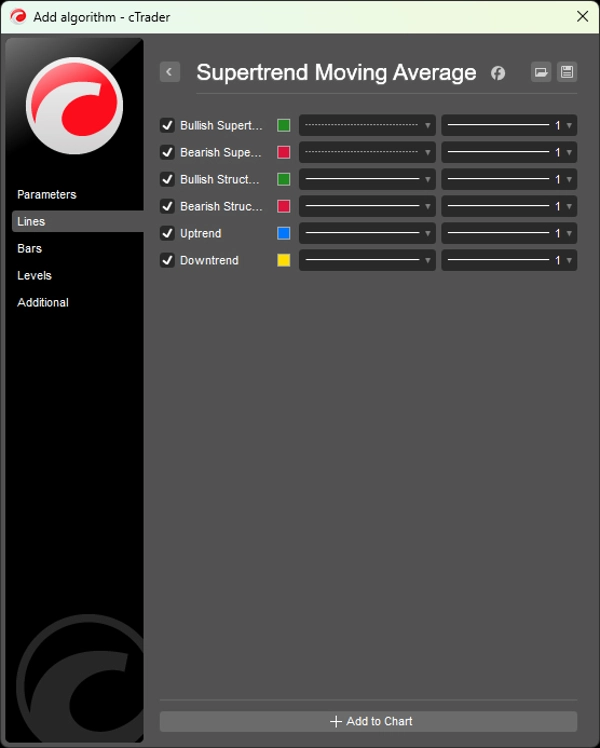
GRAFİĞİ OKUMA
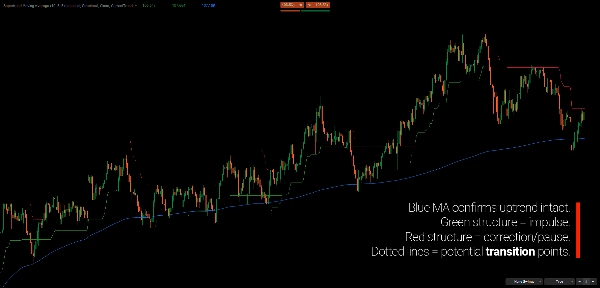
- Yeşil Yapı Çizgisi: Boğa yapısal trendi (destek)
- Kırmızı Yapı Çizgisi: Ayı yapısal trendi (direnç)
- Noktalı Çizgi: Orijinal Supertrend — yapının klasik olandan farklı olduğu zamanları gösterir
- Mavi HO: Sabit noktadan yükseliş trendi ortalaması
- Sarı HO: Sabit noktadan düşüş trendi ortalaması
- Salınım İşaretçileri: Güç simgeleriyle onaylanmış dönüş noktaları
Trend Uyum Kontrolü:
- Yapı + Orijinal uyumlu → Yüksek kesinlikli hareket
- Yapı + Orijinal farklı → Olası düzeltme veya geçiş
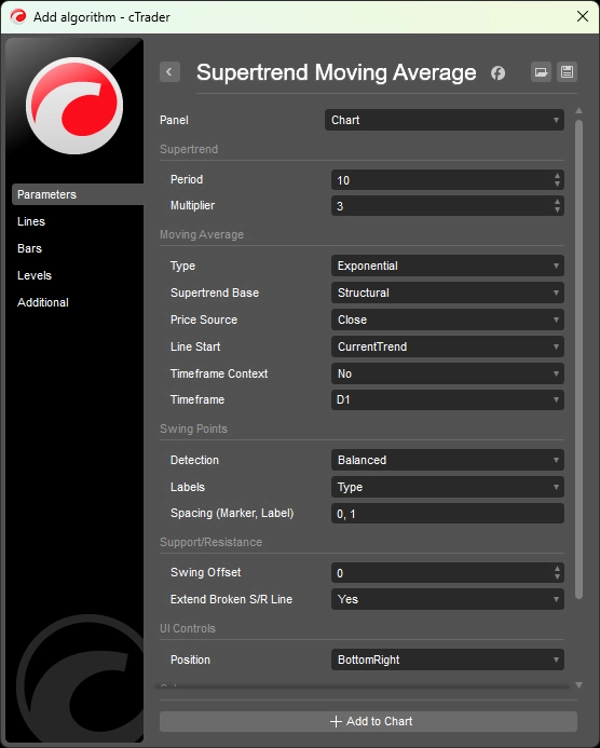
PARAMETRELER
Supertrend
- Dönem (varsayılan: 10)
- Çarpan (varsayılan: 3.0)
Hareketli Ortalama
- Tür: Yok, Basit, Üssel, Arnaud Legoux Hareketli Ortalama (ALMA)
- Supertrend Tabanı: Yapısal (varsayılan) veya Orijinal
- Fiyat Kaynağı: Kapanış, Açılış, Yüksek, Düşük, Medyan, Tipik, Ortalama
- Çizgi Başlangıcı: Mevcut Trend veya Önceki Trend
- Zaman Dilimi Bağlamı: Zaman dilimi seçimi ile etkinleştir/devre dışı bırak
Salınım Noktaları
- Algılama Modu: Yok, Minör, Dengeli, Majör
- Etiket Görüntüleme: Yok, Tür (HH/LL), Detaylı
- Özelleştirilebilir renkler ve boşluklar
KİMLER İÇİN
Bu gösterge, sinyallerden ziyade yapısal düşünceye önem veren tüccarlar için tasarlanmıştır.
Mükemmel girişleri kovalamaktan çok bir trend içinde nerede olduğunuzu anlamaya daha fazla önem veriyorsanız, bu araç sizin için oluşturuldu.
Sabit dönem hareketli ortalamalara veya sürekli parametre optimizasyonuna güvenmeden trend gelişimini nesnel olarak takip etmek isteyen trend ve salınım tüccarları için uygundur.
Çok zaman dilimli analistler, yürütme grafiklerinde doğrudan daha yüksek zaman dilimi yapısal bağlamı görmenin avantajını elde ederken, serbest tüccarlar, sabitlenmiş HO'yu geri çekilmeler, devam ve trend tükenmesi için dinamik bir referans olarak kullanabilir.
Bu, tak-çalıştır sinyal üreteci değildir. Bu, karar verme sürecinde netlik, tutarlılık ve yapısal mantara değer veren tüccarlar için bir bağlamsal çerçevedir.
FARKLI KILAN NEDİR
Ticaret kararları genellikle tanıdık bir ödünleşmeyi içerir: hızlı ama gürültülü, ya da yumuşak ama geç.
Bu gösterge, piyasanın gerçekte nasıl geliştiğine uyum sağlar. Kısa trendler duyarlı HO'lar üretir. Uzun trendler doğal olarak daha yumuşak hale gelir. Optimizasyon gerekmez — yapı dönemi belirler.
Yapısal ve Orijinal Supertrend'i karşılaştırarak, gösterge trend devamı ile trend içindeki düzeltici hareketi ayırt etmek için net bir bağlam sağlar.
---
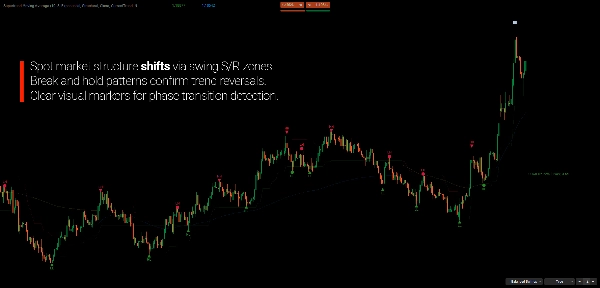
PİYASA YAPISINI ANLAMAK
Piyasa yapısı, fiyatın genişleme ve daralma dizileri aracılığıyla nasıl geliştiğinin incelenmesidir; izole mumlar veya göstergeler değil. Trendler tek hareketlerle değil, salınımlar arasındaki ilişkiyle tanımlanır — yükselen trendlerde daha yüksek tepeler ve daha yüksek dipler, düşen trendlerde daha düşük tepeler ve daha düşük dipler.
Bu bakış açısından, bir trend tahmin edilmesi gereken bir şey değil, gözlemlenip doğrulanması gereken bir şeydir. Önemli olan, fiyatın mevcut bar üzerinde yükselip düşmesi değil, altta yatan yapının sağlam kalması veya bozulmaya başlamasıdır.
Bu nedenle yapı temelli analiz, mükemmel giriş zamanlamasından çok bağlam üzerine odaklanır: piyasanın mevcut aşamasında nerede olduğu, hareketlerin impulsif mi yoksa düzeltici mi olduğu ve yeni bilgilerin mevcut yapıya nasıl uyduğu.
Piyasa yapısı etrafında oluşturulan göstergeler karar vermeyi değiştirmek için değil, fiyatın zaten ilettiği şeyi daha net yorumlamayı desteklemek için tasarlanmıştır.
---
Ticaret risk içerir. Bu gösterge teknik analiz aracıdır — her zaman uygun risk yönetimi uygulayın.
Özet
The indicator integrates dual Supertrend analyses: a Structural Supertrend that identifies major trend direction by filtering out noise and confirming genuine directional changes, and the Original Supertrend that highlights momentum shifts within the trend. Comparing these two provides context for distinguishing strong trend continuation from corrective movements.
Key features include:
- Adaptive anchor-based moving averages with options for Simple, Exponential, or Arnaud Legoux (ALMA) types.
- Multi-timeframe capability to apply higher timeframe Supertrend context on lower timeframe charts.
- Integrated swing detection with configurable modes and strength classification.
- Color-coded trend lines and swing markers for clear visual interpretation.
This tool is suited for trend and swing traders, multi-timeframe analysts, and discretionary traders seeking a structural framework to track trend development and market rhythm objectively. It emphasizes market structure and context over fixed signals, supporting clearer interpretation of price behavior.
Müşteri değerlendirmeleri
5 | 100 % | |
4 | 0 % | |
3 | 0 % | |
2 | 0 % | |
1 | 0 % |


