
Açıklama
NE YAPAR
Structural Supertrend, klasik Supertrend'in temel bir sınırlamasını ele alır: fiyat bandının ötesinde kapandığı anda yön değiştirir.
Temiz trendlerde bu iyi çalışır. Dalgalı veya kararsız koşullarda, tek bir agresif mum bile bir dönüşü tetikleyebilir — geniş trend yapısal olarak sağlam kalsa bile. Sonuç, yanıltıcı sinyaller, erken çıkışlar ve daha kötü fiyatlardan yeniden girişlerdir.
Bu gösterge farklı bir varsayıma dayanır.
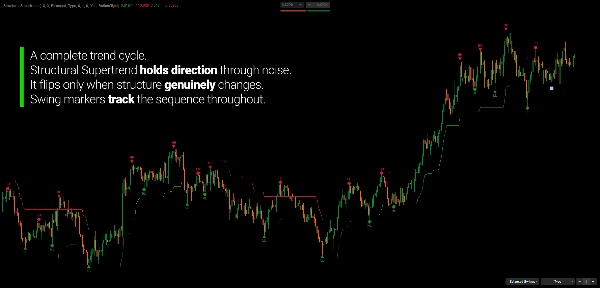
Yön değişiklikleri yalnızca fiyat gerçek bir yapısal değişikliği onayladığında olur — sadece eşik değerinin ötesinde anlık bir kapanış değil. Sonuç, daha az yanlış dönüş ve trendlerin gerçek gelişimiyle daha iyi uyumdur.
Supertrend yapısal hale gelir. Sinyaller anlamlı olur.
NEDEN STRUCTURAL SUPERTREND?
Sorun
Orijinal Supertrend, bandının ötesindeki her kapanışı bir dönüş olarak değerlendirir. Bu kasıtlıdır — göstergenin tasarım gereği tepki vermesini sağlar. Ancak tepki vermek bir bedel gerektirir.
Konsolidasyon aşamalarında, fiyat sık sık bir bandın ötesinde kapanır ve hemen geri döner. Bunların her biri bir dönüş sinyali üretir, her dönüş potansiyel bir işlem kararıdır ve her biri çıkılması gerekmeyen bir pozisyondan çıkışı temsil eder.
Supertrend'i uzun süre kullanan tüccarlar bu hayal kırıklığını iyi bilir.
Çözüm
Structural Supertrend, orijinal modeli genişleterek volatilite kaynaklı kapanışlar ile gerçek yön değişikliklerini ayırt eder. Trend yönünü değiştirmeden önce yapısal onay gerektirerek gürültüyü filtreler.
Daha az dönüş. Daha iyi trend uyumu. Bireysel mumlara karşı daha az tepki.
Neden İkisini de Tutmalı?
Orijinal Supertrend hâlâ grafikte görünür — ancak sadece Structural'dan farklı olduğu yerlerde. Bu tasarım kasıtlıdır.
- Structural ana trend yönünü takip eder
- Orijinal o trend içindeki itici ve düzeltici davranışı ortaya koyar
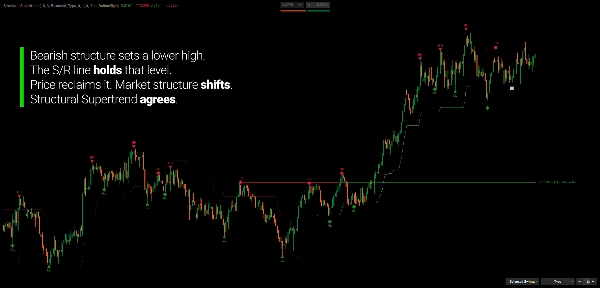
İkisi aynı fikirdeyse: güçlü yönsel kararlılık. Farklıysa: hareket muhtemelen düzeltici, gerçek bir dönüş değil. Bu çift katmanlı görünüm, tek bir çizginin sağlayamadığı bağlamı verir.
ENTEGRE SALINIM TESPİTİ
Structural Supertrend, tam bir salınım tespiti ve S/R çerçevesi içerir — ikincil bir özellik olarak değil, yapısal analizinin doğrudan bir uzantısı olarak.
Salınımlar, yapı öncelikli bir nitelendirme süreciyle tanımlanır: her aday yer değiştirme, hacim onayı ve ATR'ye göre göreceli mesafe açısından değerlendirilir ve kabul edilir. Bu, salınım haritasının her yerel ekstremum yerine anlamlı dönüş noktalarına odaklanmasını sağlar.
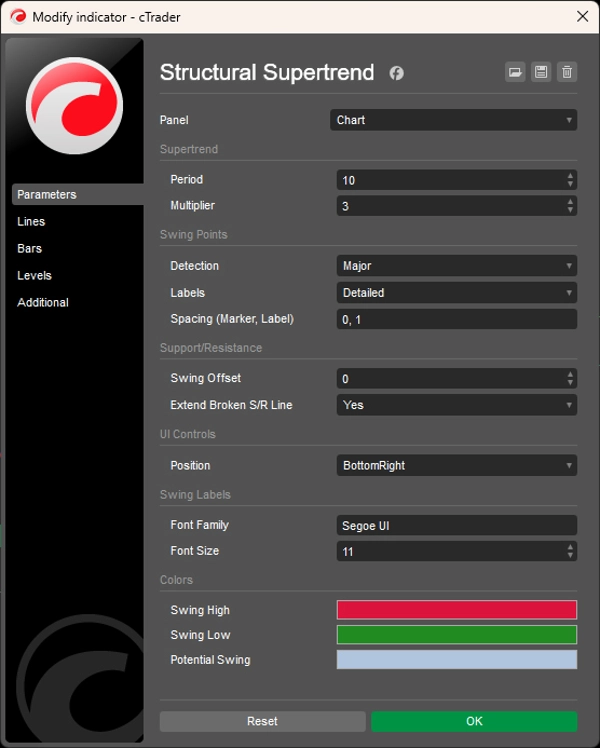
Üç Tespit Modu
- Minor — artan hassasiyet, trend içindeki iç salınımları yakalar
- Balanced — filtrelenmiş ayrıntı, çoğu kullanım durumu için en iyisi
- Major — sadece en güçlü yapısal dönüm noktaları, daha geniş kriterlerle onaylanmış
Salınım Gücü Sınıflandırması
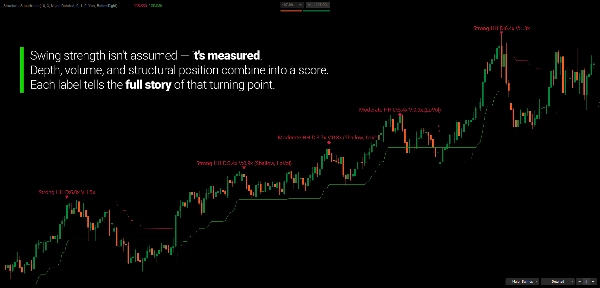
Her onaylanmış salınım, derinlik, hacim ve önceki aynı tür salınıma göre yapısal pozisyon açısından puanlanır. Güç, sabit eşik değerleri değil, son salınım geçmişine göre yüzdelik sıralama kullanılarak dinamik olarak sınıflandırılır. Görsel işaretler sınıflandırmayı yansıtır: güçlü için üçgenler, orta için elmaslar, zayıf için daireler.
S/R Bölgeleri ve Polarite Takibi
Onaylanmış salınımlar, kendi etkileşim geçmişlerini takip eden aktif S/R seviyelerine dönüşür. Fiyat bir seviyeyi tekrar ziyaret ettiğinde, gösterge temasın fitil reddi mi yoksa gövde kırılması mı olduğunu kaydeder. Bir seviye süpürüldüğünde ve ötesinde kapanış yaptığında, polarite değişir — önceki direnç destek olur ve tersi. Tekrar süpürülürse, bölge geçersiz sayılır.
Yaş etiketleri, her seviyenin ne kadar süredir aktif olduğunu ve kaç kez test edildiğini gösterir.
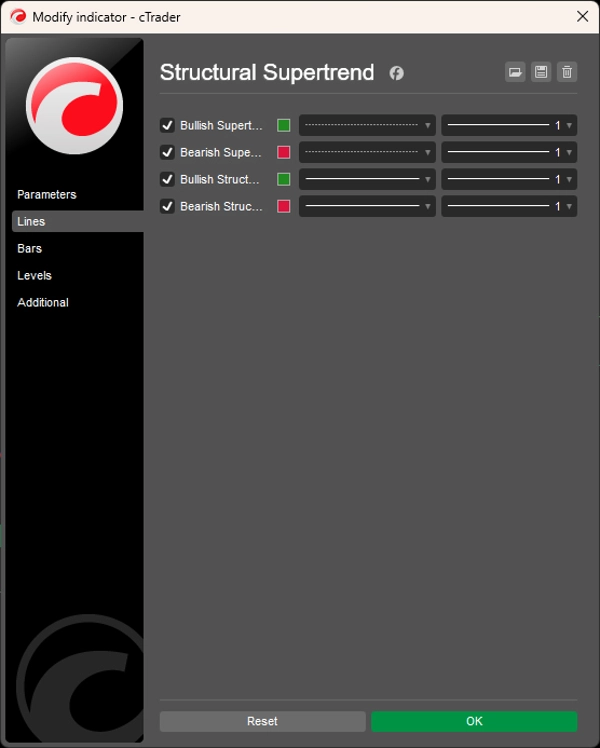
GRAFİĞİ OKUMAK
- Yeşil Yapı Çizgisi: Boğa yapısal trendi (dinamik destek)
- Kırmızı Yapı Çizgisi: Ayı yapısal trendi (dinamik direnç)
- Noktalı Çizgi: Orijinal Supertrend — sadece Structural'dan farklı olduğu yerlerde görünür
- S/R Çizgileri: Polarite durumu ve yaş ile aktif seviyeler
Trend Uyum Kontrolü:
- Yapı + Orijinal aynı → Yüksek kararlılıklı yönsel hareket
- Yapı + Orijinal farklı → Muhtemelen düzeltici veya geçiş aşaması
KİMLER İÇİN
Bu gösterge, trend yönünü ve piyasa yapısını tek, tutarlı bir çerçeveden okumak isteyen tüccarlar içindir.
Klasik Supertrend'i kullandıysanız ve çok tepki verdiğini — yanlamasına koşullarda sık sık yön değiştirdiğini — fark ettiyseniz, Structural Supertrend tam olarak bunu çözmek için tasarlandı.
Daha temiz bir yön okuması isteyen trend ve salınım tüccarları, trend sağlığını doğrulamak için salınım dizilerini takip eden yapı temelli tüccarlar ve giriş, çıkış ve pozisyon yönetimi için S/R seviyelerini bağlam olarak kullanan discretionary tüccarlar için uygundur.
Yerleşik kullanıcı arayüzü kontrolleri, gerçek zamanlı kullanım için pratiktir: tespit modlarını değiştirin, S/R referanslarını ayarlayın ve etiket detayını doğrudan grafikte açıp kapatın — ayarlar panelini açmanıza gerek yoktur.
Bu bir sinyal üretici değildir. Bu, piyasanın nerede olduğunu anlamak isteyen tüccarlar için bir yapısal analiz çerçevesidir, sadece şu anda ne yaptığını değil.
FARKLI KILAN NEDİR
Çoğu Supertrend uygulaması, bandın ötesindeki her kapanışı işlem yapılabilir olarak değerlendirir. Bu gösterge bunu bir aday olarak ele alır — ve yön değişikliğine karar vermeden önce yapısal kanıt ister.
Çoğu salınım detektörü, değerlendirme kriterleri olmadan yerel yüksek ve düşükleri belirler. Bu gösterge, her salınımı yer değiştirme, hacim ve yapısal pozisyon açısından nitelendirir — ve gücü son salınım geçmişine göre dinamik olarak puanlar.
Çoğu S/R aracı bir çizgi çizer ve bırakır. Bu gösterge etkileşim geçmişini takip eder, polarite değişikliklerini işaretler ve piyasa her seviyeyi tekrar ziyaret ettikçe gelişmeye devam eder.
Sonuç: daha uzun süre alakalı kalan, gürültüye daha az tepki veren ve zamanla piyasa koşullarının daha zengin bir resmini oluşturan bir trend ve yapı aracı.
---
YAPISAL ANALİZİ ANLAMAK
Piyasa yapısı, "doğru" salınımı veya "doğru" trend yönünü bulmakla ilgili değildir. Fiyat dizilerinin nasıl geliştiğine dair nesnel bir resim tutmakla ilgilidir — ve bu dizinin tutarlı kalıp kalmadığı veya bozulmaya başlayıp başlamadığı ile ilgilidir.
Bir trend, tek bir hareketle değil, bir dizi ilişkiyle tanımlanır: yükselen trendlerde daha yüksek tepeler ve daha yüksek dipler, düşen trendlerde daha düşük tepeler ve daha düşük dipler. Her yeni salınım ya mevcut diziyi onaylar ya da sorgular. Onay devam ettiğinde yapı sağlamdır. Kırıldığında yapı geçiş halindedir.
Yapısal analizi faydalı kılan şey, fiyatın nereye gideceğini tahmin etmesi değil, fiyatın kendi dizisi içinde şu anda nerede olduğunu tanımlamasıdır. Bu ayrım önemlidir. Tahmin gelecekle ilgili varsayımlar gerektirir. Yapısal gözlem ise sadece zaten olmuş olanın doğru okunmasını gerektirir.
Yapısal mantık üzerine kurulu göstergeler, bu gözlemi desteklemek için tasarlanmıştır — diziyi görünür ve takip edilebilir kılmak için, öznel yorum getirmeden. Amaç, mevcut piyasa koşulları hakkında netlik, gelecekteki fiyat yönü hakkında kesinlik değil.
---
Ticaret risk içerir. Bu gösterge teknik analiz aracıdır — her zaman uygun risk yönetimi uygulayın.
Özet
Müşteri değerlendirmeleri
5 | 67 % | |
4 | 33 % | |
3 | 0 % | |
2 | 0 % | |
1 | 0 % |


!["Smart Money Concepts (SMC) [Iridio Capital]" logosu](https://cdn.ctrader.com/image/webp/28b69fd1-ef54-4bed-9487-07e78e883be4_40934)


