
Açıklama
Çok Zaman Dilimli İşlem Yapılabilirlik Endeksi
The Çok Zaman Dilimli İşlem Yapılabilirlik Endeksi, piyasanın istatistiksel olarak işlem için uygun olduğu zamanları belirleyen gelişmiş bir piyasa koşulu analizörüdür. Alım veya satım sinyalleri üretmek yerine, mevcut piyasa koşullarının birden fazla zaman diliminde ne kadar işlem yapılabilir olduğunu ölçer ve böylece sadece fiyat hareketinin temiz, yönlü ve anlamlı hareketler üretebileceği dönemlere odaklanmanızı sağlar.
Sabit eşiklere dayanan geleneksel göstergelerin aksine, bu gösterge her zaman dilimine kendi tarihsel temel çizgisi ile mevcut piyasa davranışını karşılaştırarak sürekli uyum sağlar. Bu kendi kendini kalibre eden yaklaşım, manuel optimizasyona gerek kalmadan Forex, endeksler, emtialar, kripto paralar ve diğer CFD piyasalarında çalışmasını sağlar.
Nasıl Çalışır
Gösterge, her zaman diliminde piyasanın altı bağımsız özelliğini değerlendirir.
Piyasa Ortalama Endeksi kullanarak trend ile rastgelelik arasındaki fark.
Fraktal Boyut kullanarak pürüzsüzlük ile dalgalanma arasındaki fark.
Anlamlı salınımların rastgele dalgalanmalara baskın olup olmadığını belirlemek için sinyal-gürültü oranı.
Fiyatın sürekli tersine dönmek yerine ne kadar verimli hareket ettiğini ölçerek trend temizliği.
Önemli salınım bacaklarını sayarak işlem fırsatı sıklığı.
Fiyatın tekrar tekrar geri çekilmek yerine anlamlı ilerleme kaydedip kaydetmediğini belirlemek için net yönlü ilerleme.
Her faktör, kendi tarihsel davranışına göre istatistiksel z skoru analizi kullanılarak normalize edilir. Bu, göstergenin mevcut koşulların basitçe rastgele bir eşik değerinin üzerinde veya altında olup olmadığını değil, olağanüstü derecede uygun olup olmadığını değerlendirdiği anlamına gelir.
Normalize edilmiş faktörler, 0 ile 100 arasında değişen ağırlıklı bir puana dönüştürülür.
Gösterge ayrıca, ortalama fiyat salınımlarının spread ve komisyonları gerçekçi şekilde aşamayacak kadar küçük olduğu kısa zaman dilimlerinin yüksek puan almasını engelleyen bir işlem maliyeti filtresi içerir.
Gösterge Paneli
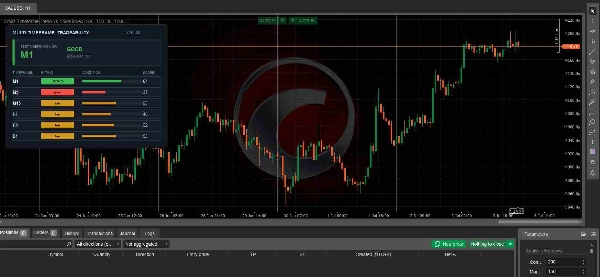
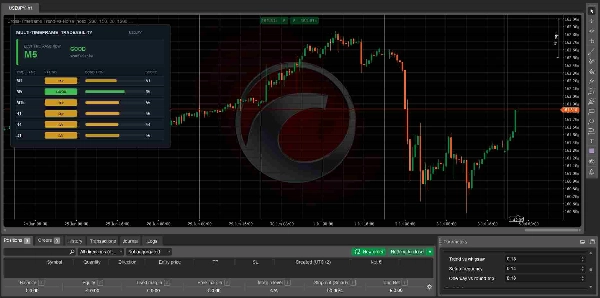
Panel, altı zaman dilimini aynı anda analiz eder.
M1
M5
M15
H1
H4
D1
Her zaman dilimi üç derecelendirmeden birini alır.
İYİ, son derece elverişli piyasa koşullarını gösterir.
ORTA, kabul edilebilir ancak daha az ideal koşulları gösterir.
KÖTÜ, piyasa yapısının şu anda elverişsiz olduğunu gösterir.
Gösterge, en yüksek puan alan zaman dilimini ve mevcut İşlem Yapılabilirlik Puanını otomatik olarak vurgular.
Puanların Yorumlanması
80 ile 100 arası, güçlü yönlü hareket ve düşük piyasa gürültüsü ile olağanüstü işlem koşullarını gösterir.
60 ile 79 arası, işlem stratejilerinin iyi performans gösterebileceği çok iyi koşulları gösterir.
40 ile 59 arası, seçiciliğin önerildiği ortalama koşulları gösterir.
40'ın altı, aşırı rastgelelik, dalgalanma veya yetersiz hareket ile kötü piyasa yapısını gösterir.
Daha yüksek puanlar piyasa yönünü tahmin etmez. Sadece hangi yön gelişirse gelişsin, istatistiksel olarak daha temiz ve daha işlem yapılabilir fiyat hareketi üretme olasılığının daha yüksek olduğunu gösterir.
Ana Parametreler
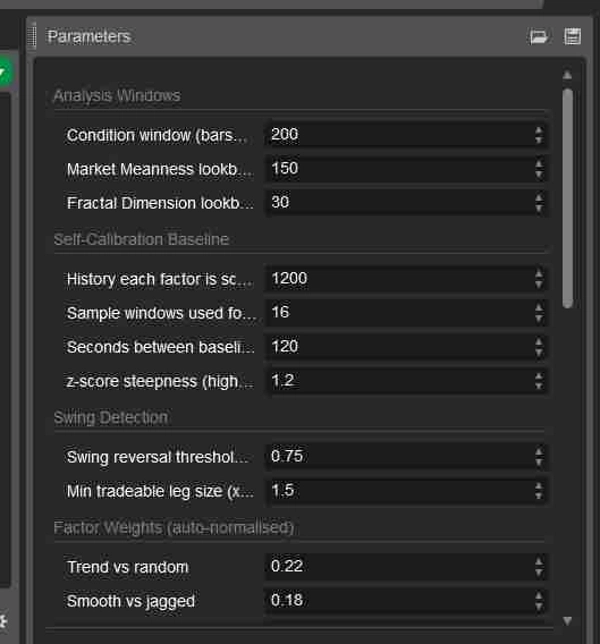
Analiz Pencereleri, her faktörün hesaplanmasında kullanılan piyasa geçmişi miktarını kontrol eder.
Kendi Kendini Kalibre Etme Temeli, tarihsel normalizasyonun nasıl yapıldığını belirler.
Salınım Algılama, önemli fiyat salınımlarını tanımlamak için kullanılan hassasiyeti ayarlar.
Faktör Ağırlıkları, gelişmiş kullanıcıların her piyasa özelliğinin önemini vurgulamasına veya azaltmasına olanak tanır.
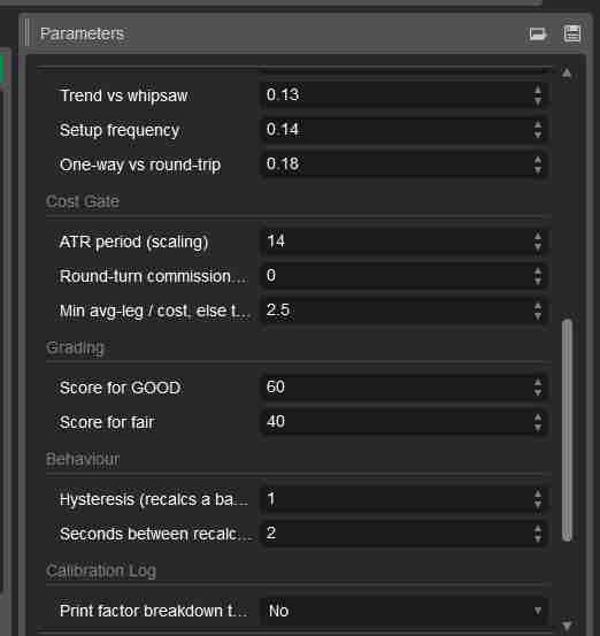
Maliyet Kapısı, işlem maliyetlerinin nihai derecelendirmeyi ne kadar agresif etkilediğini kontrol eder.
Derecelendirme ayarları, İYİ ve ORTA sınıflandırmaları için puan eşiklerini tanımlar.
Panel ayarları, panel boyutu ve ekran konumu üzerinde tam kontrol sağlar.
En İyi Kullanım Alanları
Giriş aramadan önce en işlem yapılabilir zaman dilimini bulmak.
Yanlamasına, gürültülü veya düşük kaliteli piyasa koşullarından kaçınmak.
Mevcut işlem stratejilerinden gelen sinyalleri filtrelemek.
Sadece istatistiksel olarak elverişli ortamlara odaklanarak takdirî işlemi geliştirmek.
Uyarlanabilir bir piyasa koşulu filtresi ile algoritmik sistemleri desteklemek.
Kimler İçin
Bu gösterge, piyasa koşullarının uygun olduğu zamanlar hakkında nesnel rehberlik isteyen yeni başlayanlar ile birden çok enstrüman ve zaman diliminde çalışan uyarlanabilir bir piyasa kalitesi filtresi arayan deneyimli takdirî ve algoritmik işlemciler için uygundur.
Önemli Notlar
Bu gösterge bir alım veya satım sinyali üreticisi değildir.
Gelecekteki fiyat yönünü tahmin etmez.
Sadece mevcut piyasa koşullarının kalitesini ölçer.
En iyi sonuçlar için, mevcut giriş, çıkış ve risk yönetimi stratejinizle birleştirin. En yüksek olasılıklı işlemler genellikle kendi işlem düzeninizin İYİ İşlem Yapılabilirlik derecesi alan zaman dilimleriyle uyumlu olduğu zaman gerçekleşir.
Özet
The indicator provides a weighted Tradeability Score from 0 to 100 for six timeframes (M1, M5, M15, H1, H4, D1), classifying each as GOOD, FAIR, or POOR based on current market quality. It includes a transaction cost filter to account for realistic trading conditions on shorter timeframes. The dashboard highlights the highest scoring timeframe and its score, helping traders focus on periods with clean, directional price action suitable for trading.
This tool does not generate buy or sell signals nor predict price direction; instead, it serves as a market quality filter to improve discretionary or algorithmic trading by signaling when conditions are statistically favorable. Key parameters allow customization of analysis windows, swing detection sensitivity, factor weights, and grading thresholds. It is suitable for traders seeking objective guidance on market structure and tradeability across multiple instruments and timeframes.