

설명
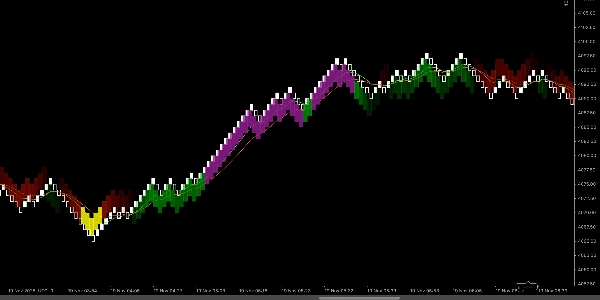
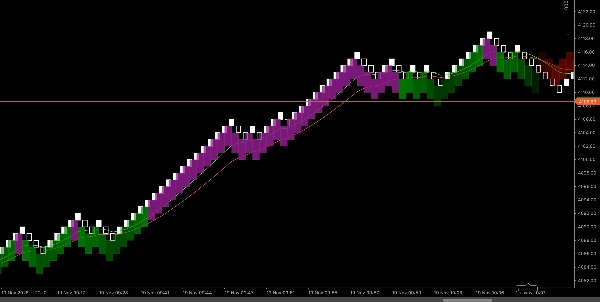
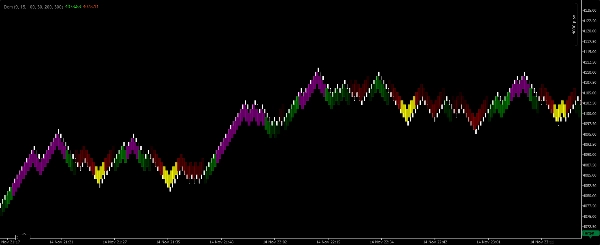
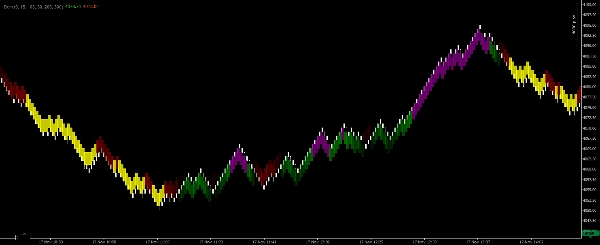
Renko EMA-Scalper Zones 은 cTrader 플랫폼의 Renko 100-pip 차트 전용으로 제작된 가볍고 시각적인 스캘퍼 지표입니다. 두 개의 지수 이동 평균(EMA)을 사용하여 단기 추세 방향을 식별하고 깨끗하고 거래 가능한 영역을 강조합니다. 이 지표는 차트에 네 가지 색상의 채워진 사각형을 그려 스캘퍼가 수동으로 숫자를 계산하지 않고도 즉시 시장 편향을 읽고 더 높은 확률의 진입점을 찾을 수 있게 합니다.
각 색상이 의미하는 바
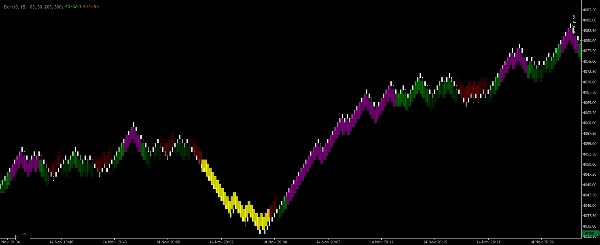
- 녹색 사각형 — 강세 추세가 확인됨. 빠른 EMA가 느린 EMA 위에 있고 EMA들이 상승 방향으로 정렬되어 있습니다. 단기 추세를 따르는 롱 포지션에 사용하세요.
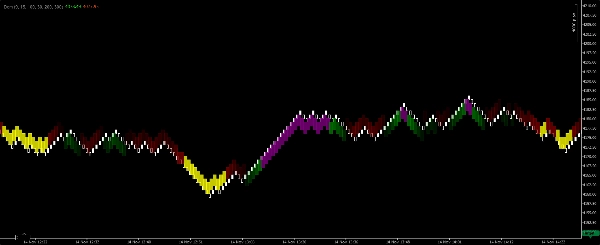
- 보라색 사각형 — 강세 맥락 내 매수 진입 구역입니다. 활성 강세 추세 내에서 단기 조정 또는 횡보를 나타내며 스캘핑 진입 기회를 제공할 수 있습니다.
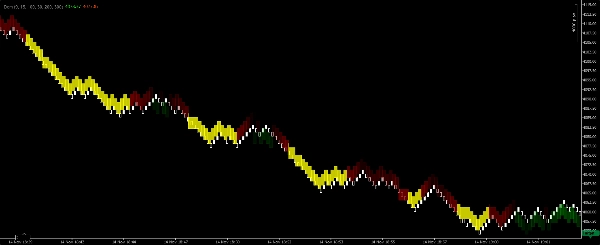
- 빨간색 사각형 — 약세 추세가 확인됨. 빠른 EMA가 느린 EMA 아래에 있고 EMA들이 하락 방향으로 정렬되어 있습니다. 단기 추세를 따르는 숏 포지션에 사용하세요.
- 노란색 사각형 — 약세 맥락 내 매도 진입 구역입니다. 활성 약세 추세 내에서 단기 조정 또는 횡보를 나타내며 스캘핑 진입 기회를 제공할 수 있습니다.
작동 원리 (논리 요약)
- 이 지표는 Renko 100-pip 차트에서 두 개의 EMA(빠른 EMA와 느린 EMA)를 계산하고, 이들의 상대적 정렬과 기울기를 평가하여 추세 방향을 결정합니다.
- EMA가 명확한 강세 정렬과 모멘텀을 나타낼 때, 지표는 추세 영역을 가로지르는 녹색 사각형을 그립니다. 그 강세 영역 내에서 짧은 횡보나 조정이 나타나면, 지표는 매수 진입 기회를 표시하기 위해 보라색 사각형을 그립니다.
- 약세 조건에 대해서는 동일한 논리가 반대로 적용되어 빨간색 (추세) 및 노란색 (진입) 사각형을 생성합니다.
- 사각형은 단일 바가 아닌 구역으로 그려져 스캘퍼가 빠른 진입과 청산 타이밍을 시각적으로 평가할 수 있습니다.
권장 설정 (스캘퍼 기본값)
- 차트 유형: Renko
- Renko 벽돌 크기: 100 pips (이 지표는 이 벽돌 크기에 맞게 설계되었습니다).
- 민감도 / 감지 — 조정 가능한 매개변수로, 지표가 추세 사각형을 그리기 전에 EMA 정렬을 얼마나 엄격하게 요구하는지 제어합니다 (낮을수록 신호가 많고, 높을수록 신호가 적고 강력함).
- 사각형 불투명도 — 가격 바 위에서 시각적 명확성을 위해 조정합니다.
- 세션 필터 — 스캘핑을 위해 유동성이 높은 시간대로 제한하는 것이 권장됩니다.
- 최대 구역 너비 (바 수) — 과도하게 확장된 구역을 피하기 위한 선택적 제한입니다.
사용 지침 및 스캘퍼 규칙
- 녹색/빨간색 사각형을 추세 확인으로 간주하세요. 색상으로 표시된 추세 구역 방향으로 거래하는 것을 선호하며, 추세 사각형이 지배적일 때는 공격적인 역추세 스캘핑을 피하세요.
- 확인된 추세 내에서 보라색/노란색 사각형을 스캘핑 진입 창으로 사용하세요 — 진입 전에 빠른 마이크로 구조 트리거(예: 모멘텀 바, 작은 횡보 돌파)를 찾으세요.
- 목표는 스탑의 작은 배수로 스캘핑에 적합하고 현실적이어야 합니다. 위험 프로필에 따라 고정 핍 목표나 최소 바 확인을 사용하세요.
- 스탑은 최근 마이크로 구조의 저점/고점 너머나 진입 구역 밖에 배치하세요; 스캘핑은 규율 있는 작은 손실이 필요합니다.
- 가능하다면 거래량/가격 행동 확인과 결합하고 활성 세션 동안에만 거래하세요.
- 사용하는 도구에서 시각적으로 백테스트하세요 — Renko 100-pip은 변동성이 큰 페어와 100-pip 벽돌이 스캘핑에 유용한 가격 구조를 생성하는 도구에 적합합니다.
요약
지표 프로필
고객 리뷰
4.2
리뷰: 4
5 | 50 % | |
4 | 25 % | |
3 | 25 % | |
2 | 0 % | |
1 | 0 % |
고객 리뷰
November 25, 2025
A decent setup here should survive 50 quick trades without looking messy. A few sessions of data make the result easier to trust. The useful comparison is hit rate versus average R.
November 18, 2025
The product feels more useful when the plan is already written down. A 13 setup run on daily close keeps the review grounded.
November 18, 2025
This feels useful when you already has a plan. The main value is short term execution, not chasing every signal that appears. Early sizing should stay modest until the journal looks stable.
November 18, 2025
Useful tool, but not for lazy entries. It supports short term execution and feels more useful if the trader stays selective.
상담
자주 묻는 질문(FAQ)
BTCUSD
Forex
Signal
Scalping
Commodities
Crypto
XAUUSD
트레이딩 봇, 지표, 플러그인 등 cTrader Store에서 제공되는 상품은 제3자 개발자에 의해 제공되며, 이는 단순히 정보 및 기술적 접근을 목적으로 제공된 것입니다. cTrader Store는 중개인이 아니며, 투자 조언, 개인별 추천 또는 향후 성과에 대한 어떠한 보장도 제공하지 않습니다.
이 작성자의 상품 더 보기


!["[Stellar Strategies] Market Session Ultimate" 로고](https://cdn.ctrader.com/image/webp/61ffd537-0125-4246-9e72-42eca1791d64_28232)


가격
가입일 14/03/2025
23
판매