
Açıklama
✅ Pürüzsüz renk değiştiren trend çizgisi, yön değişimine anında uyum sağlar
✅ İsteğe bağlı yukarı ve aşağı oklar, net trend değişim sinyalleri için
✅ Temiz, güvenilir trend geçişlerini vurgulamak için gürültüyü filtreler
✅ Trend takibi, geri çekilmeler ve dönüşler için idealdir
✅ Tamamen özelleştirilebilir: dönem, hassasiyet ve ok gösterimi
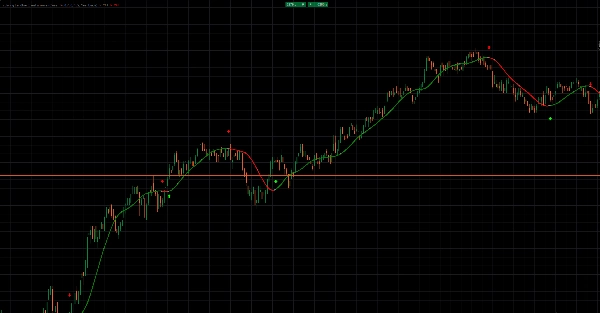
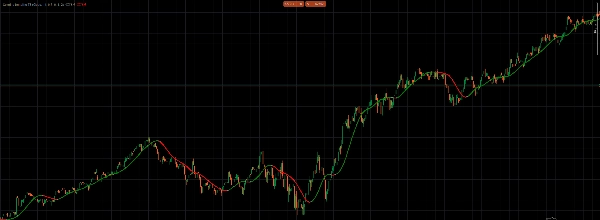
Oklarla Renklendirilmiş Trend Çizgisi, piyasadaki yönü pürüzsüz ve duyarlı bir şekilde gösterir, karmaşa yaratmaz.
Trend çizgisi, boğa piyasası dönemlerinde yeşile ve ayı piyasası dönemlerinde kırmızıya dinamik olarak geçiş yapar, böylece trend yönü anında okunabilir olur.
Momentum değiştiğinde, isteğe bağlı oklar bu değişikliği işaret eder — yukarı trendler için yeşil oklar, aşağı trendler için kırmızı oklar.
Bu, piyasa gürültüsünden kaynaklanan yanlış sinyallerden kaçınırken trend dönüşlerini erken yakalamanızı sağlar.
Açıklık için tasarlanmış olup, fiyatlara pürüzsüzce uyum sağlar ve güçlü yön yapısını korur.
Giriş zamanlaması, çıkış yönetimi ve baskın trendle uyum sağlamak için mükemmeldir.
Tek başına bir trend aracı olarak kullanabilir veya ek onay için mevcut stratejinizle birleştirebilirsiniz.
Temiz görseller. Net sinyaller. Kendinden emin trend ticareti.
Özet
Müşteri değerlendirmeleri
5 | 0 % | |
4 | 100 % | |
3 | 0 % | |
2 | 0 % | |
1 | 0 % |


