"ZigzagSR" 로고
지표
5 구매
버전 1.0, Jun 2025
Windows, Mac
4.3
리뷰: 3
"ZigzagSR" 업로드된 이미지
"ZigzagSR" 업로드된 이미지
"ZigzagSR" 업로드된 이미지
가입일 22/11/2024
130
판매
2.53K
무료 설치

ZigzagSR – 자동 지원 및 저항이 포함된 동적 지그재그 스윙

ZigzagSR과 함께 더 명확한 시장 구조와 정확한 진입 구역을 잠금 해제하세요. 이 강력한 cTrader 지표는 다음을 수행합니다:

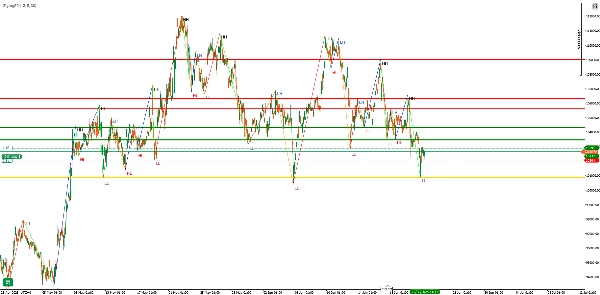
  • 실시간으로 비재도장 지그재그 스윙(더 높은 고점, 더 낮은 고점, 더 높은 저점, 더 낮은 저점)을 표시합니다
  • 가장 최근의 피벗 스윙을 기반으로 동적 지원 및 저항 수준을 자동으로 그립니다
  • 각 스윙 포인트(“HH”, “LH”, “HL”, “LL”)에 라벨을 붙여 한눈에 추세를 명확히 합니다


주요 기능

  • 적응형 지그재그 감지
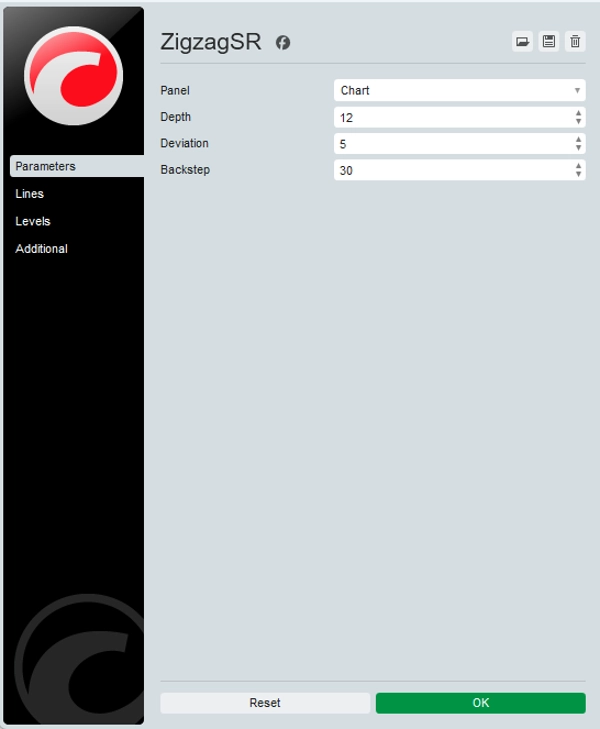
    • 시장 노이즈에 대한 민감도를 미세 조정할 수 있는 구성 가능한 Depth, DeviationBackstep 매개변수
    • 비재도장 로직으로 한 번 그려진 과거 신호가 안정적으로 유지됩니다
  • 자동 SR 레벨
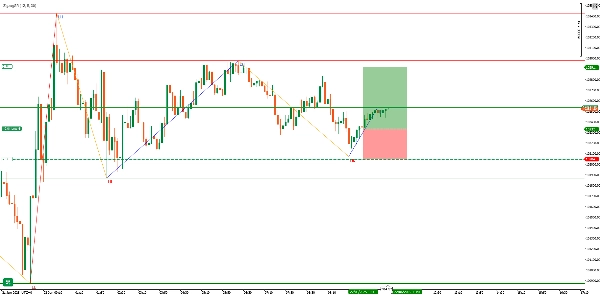
    • 마지막 유효 스윙 포인트에 피벗 라인을 그립니다(금색 선)
    • 피벗 이전의 최대 세 개의 저항 고점(빨간 선)과 세 개의 지원 저점(녹색 선)을 강조 표시합니다
    • 새로운 스윙이 형성됨에 따라 선이 원활하게 업데이트되어 차트를 깔끔하게 유지합니다
  • 명확한 시각적 라벨
    • 약세/더 높은 고점에 대한 “HH”(더 높은 고점) 및 “LH”(더 낮은 고점)
    • 강세/더 낮은 저점에 대한 “HL”(더 높은 저점) 및 “LL”(더 낮은 저점)
    • 색상 코드가 지정된 지그재그 구간:
      • HH → 라임
      • LH → 오렌지
      • HL → 파랑
      • LL → 빨강


입력 및 사용자 정의

매개변수기본값설명

Depth

12

지역 고점/저점을 식별하기 위한 되돌아보는 바 수

Deviation

5

스윙으로 간주하기 위한 최소 가격 움직임(틱 단위)

Backstep

3

잘못된 피벗을 억제하기 위해 “되감기”할 바 수

팁: 더 높은 타임프레임에서 노이즈를 필터링하려면 DepthDeviation 값을 높이고, M1/M5에서는 민감도를 위해 값을 낮추세요.


왜 ZigzagSR를 사용해야 하나요?

  1. 추세 확인: 충동 스윙과 조정 움직임을 명확히 구분—스윙 및 돌파 거래자에게 이상적입니다.
  2. SR 진입 구역: 자동으로 표시된 레벨로 수동으로 선을 그리지 않고도 진입, 손절, 이익 실현 구역을 정확히 파악할 수 있습니다.
  3. 전략 개발: 라벨과 선이 EA/cBot 또는 수동 시스템에 직접 입력되어 일관된 규칙 기반 설정을 구축할 수 있습니다.


작동 원리

  1. 고점/저점 매핑
    • 마지막 Depth 기간 동안의 바를 스캔하여 지역 극값(_highMap_lowMap)을 표시합니다.
  2. 스윙 구성
    • 강세와 약세 상태를 번갈아 가며 중요한 피벗만 스윙 목록에 추가합니다.
  3. 라벨 할당
    • 각 피벗을 이전 피벗과 비교하여 HH/LH 또는 HL/LL로 태그합니다.
  4. SR 그리기
    • 최신 피벗을 “피벗 라인”으로 식별한 후, 이전의 세 개의 유효 고점과 저점을 저항/지원으로 표시합니다.
  5. 지그재그 렌더링
    • 모든 스윙 포인트를 색상 있는 추세선으로 연결하고, 명확성을 위해 약간 오프셋된 텍스트 라벨을 오버레이합니다.


사용 사례 및 팁

  • 스윙 트레이딩: 다중 바 충동을 타고 피벗 라인으로 되돌림 시 진입, 다음 SR 레벨을 목표로 합니다.
  • 돌파 확인: ZigzagSR이 그린 저항선을 가격이 돌파할 때까지 기다린 후, 거래량 또는 RSI로 확인하세요.
  • 다른 지표와 오버레이: 이동평균, RSI 다이버전스 또는 거래량 프로필과 결합하여 신호를 강화하세요.


몇 초 만에 시작하세요:

  1. cTrader 스토어에서 ZigzagSR을 설치하세요.
  2. 어떤 차트에든 드롭하세요—외부 라이브러리 필요 없음.
  3. 세 가지 입력 매개변수를 원하는 타임프레임과 전략 스타일에 맞게 조정하세요.

실시간 스윙 구조와 동적 지원 및 저항으로 차트 분석을 향상하세요—오늘 바로 ZigzagSR을 사용해 보세요!

지표 프로필
4.3
리뷰: 3
5
33 %
4
67 %
3
0 %
2
0 %
1
0 %
고객 리뷰
November 9, 2025
ZigzagSR combines classic wave mapping with auto S/R zones. Clean, responsive, and great for spotting turning points. A must-have for structure-focused traders. Could use alerts for new high/low formations, but performance and clarity are top-notch.
July 6, 2025
the review gets easier when it adds a check without pretending to know everything, and It needs a boring test before bigger size.
July 4, 2025
A small account test feels safer. The trade review has a better rhythm.
Breakout
Commodities
RSI
XAUUSD
트레이딩 봇, 지표, 플러그인 등 cTrader Store에서 제공되는 상품은 제3자 개발자에 의해 제공되며, 이는 단순히 정보 및 기술적 접근을 목적으로 제공된 것입니다. cTrader Store는 중개인이 아니며, 투자 조언, 개인별 추천 또는 향후 성과에 대한 어떠한 보장도 제공하지 않습니다.

이 작성자의 상품 더 보기

지표
RSI
Forex
+4
Advanced RSI Indicator with multi-MA smoothing, Bollinger Bands, divergence detection, and fill zones for cTrader.
지표
AI
ATR
+27
The Support & Resistance Pro helps traders identify key support and resistance levels for informed trading decisions.
cBot
FiboSmart cBot automates Fibonacci-based trading with trend, RSI, and MACD filters, plus built-in money management, trai
지표
AI
SMC
+5
Complete ICT Killzones: 5 sessions, easy colors, transparency controls & session info. Professional timing for cTrader.
지표
RSI
MACD
Unlock market insights with our Multi-Timeframe Market Levels indicator, enhancing your trading strategies effortlessly
지표
ATR
Forex
+3
LevelMaster S/R: Pinpoint key support & resistance zones with precision. Perfect for traders of all levels Trade smarter
지표
SMC
Forex
+5
ICT liquidity engine for Gold: maps stop clusters, scores zones & projects the next target. Now with 4 ICT killzones.
지표
SmartFibonacci — automatic Fibonacci retracements & extensions with swing detection, alerts and clean labels for cTrader
지표
ATR
RSI
+5
Advanced Anchored VWAP for cTrader: volatility bands, real‑time alerts & customizable session resets.
지표
MACD
Forex
+5
🚀 MACD Pro Trader – Advanced MACD with buy/sell signals, custom MAs & color-coded histograms for smarter trading! 📈🔥
지표
AI
ATR
+20
Detects smart money activity using advanced tick volume and price divergence analysis.
지표
RSI
MACD
+1
Precision Supply & Demand zones indicator—automatically plots key buy/sell areas on your chart for smarter entries.

좋아하실 만한 다른 항목

지표
Displays the previous day's, last week's, and last month's highest and lowest price levels on your chart.
지표
RSI
BTCUSD
+5
Identify market structure effortlessly with swing highs, lows, CHoCH, and BOS levels for smart trading decisions! 📊🔍"
지표
RSI
VegaXLR's cTrader StochRSI identifies overbought/oversold RSI levels for precise trade entries.
지표
Forex
Multi-timeframe candlesticks!
지표
EMA
SMA
+3
MACD indicator modeled after TradingView, featuring a 4-color momentum histogram, sound/pop-up crossover alerts.
지표
Spread Filter
SpreadSync Entry Timer is a compact cTrader indicator that shows live spread and candle-close.
지표
📊 Smart Floating Risk Pro – Advanced Risk Management for cTrader
지표
Prop
VWAP
+5
VWAP is a powerful tool for intraday traders
지표
Prop
Forex
+5
Tracks NY, London, Tokyo, Sydney sessions with custom visuals, and a real-time expanding range box and breakout High/Low
지표
Indices
Breakout
+1
You can use the cTrader Pivot Points Pro indicator to find a good pullback entry in a trend
지표
Forex
EURUSD
+7
Institutional Session Levels Pro OHLC,Prev(D,W,M OHLC)
지표
Forex
BTCUSD
+10
Enhance trading with TSI! Use the True Strength Index for clear insights into market momentum and trend strength.
지표
MACD
Signal
Enhance your trading strategy with our customizable TradingViewMACD indicator. Optimize and elevate your market analysis
지표
SmartFibonacci — automatic Fibonacci retracements & extensions with swing detection, alerts and clean labels for cTrader
지표
BOS
Fibonacci
+4
Automatically draws major trading sessions, killzones, and SMC daily liquidity targets directly on your cTrader charts.
지표
Indices
Custom ADX Indicator for precise trend analysis. المؤشر المخصص ADX لتحليل الاتجاه بدقة
지표
EMA
Supertrend
+4
Dynamic dual MA cloud indicator. Identifies trends, crossovers, and pullback entries in real time for any asset.
지표
BOS
Key Levels
+4
Automatically plots the Opening Range Breakout (ORB) box for all 3 major session: Asia, London and New York
가입일 22/11/2024
130
판매
2.53K
무료 설치