
설명
주요 특징:
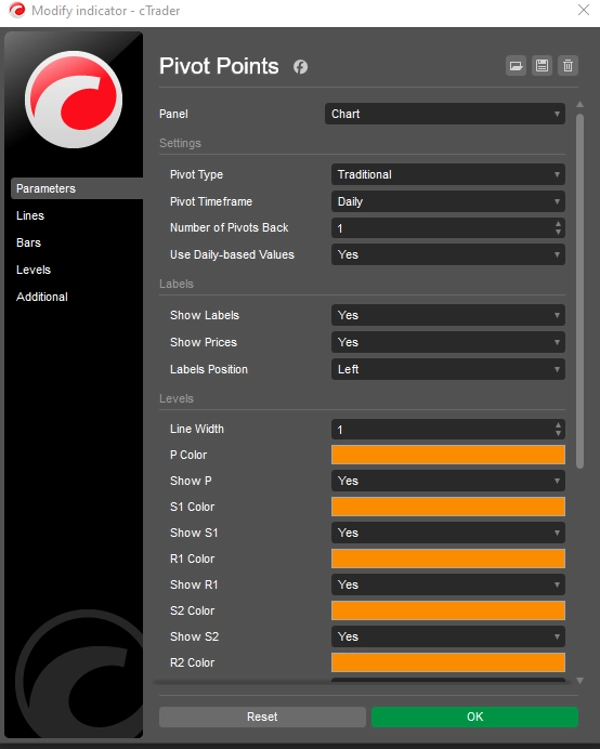
- 다양한 피벗 스타일: 클래식, 피보나치, 우디, 카마릴라, DM, 전통 등 6가지 피벗 계산 방법을 원활하게 전환할 수 있습니다. 각 방법은 서로 다른 수준을 지원합니다(전통 및 카마릴라는 R5/S5까지, 피보나치는 R3/S3까지, DM은 P/R1/S1까지).
- 유연한 시간 프레임: 자동, 일간, 주간, 월간, 분기별, 연간 및 다년 옵션(2년, 3년, 5년, 10년) 등 다양한 피벗 시간 프레임 중에서 선택할 수 있어 거래 기간에 맞게 조정할 수 있습니다.
- 과거 피벗 제어: Number of Pivots Back 매개변수를 사용하여 표시할 과거 피벗 세트 수(1~200)를 설정할 수 있어, 주요 과거 수준을 유지하면서 차트를 깔끔하게 유지합니다.
- 사용자 정의 가능한 외관: 색상, 선 두께, 라벨 설정을 완전히 조정할 수 있습니다. 라벨과 가격 값을 켜거나 끌 수 있으며, 라벨 위치(왼쪽 또는 오른쪽)를 선택하고 명확성을 위한 스마트 수직 오프셋을 적용할 수 있습니다.
- 일간 또는 인트라데이 데이터: 일간 기반 값 또는 차트 시간 프레임 데이터를 사용할 수 있어 다양한 거래 전략에 유연성을 제공합니다.
- 최적화된 성능: 경량의 네이티브 cTrader 코드로 지연 없이 빠르고 실시간 업데이트를 보장하며, 외환, 지수, 원자재, 암호화폐 등과 호환됩니다.
왜 Pivot Points Standard를 선택해야 할까요?
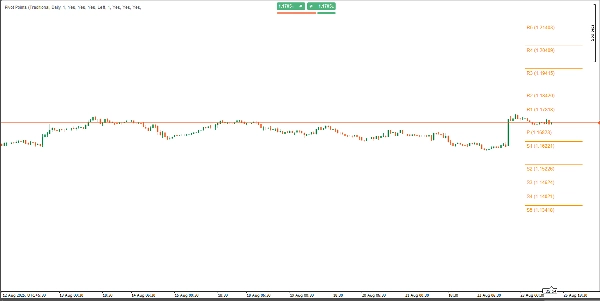
- 다목적 거래 도구: 모든 시장과 시간 프레임에서 주요 지지/저항 수준, 추세 방향, 돌파 기회를 식별할 수 있습니다.
- 사용자 친화적 인터페이스: 피벗 유형, 시간 프레임, 라벨 위치를 위한 직관적인 드롭다운 메뉴로 맞춤 설정이 쉽습니다.
- 과거 분석: 최대 200개의 과거 피벗 세트를 시각화하여 과거 가격 상호작용을 연구하고 전략을 개선할 수 있습니다.
- 깔끔한 차트: 스마트 라벨 위치 지정과 사용자 정의 가능한 선 길이로 차트 혼잡을 방지하여 가독성을 높입니다.
사용 방법:
- 지표를 cTrader 차트에 적용하세요.
- 선호하는 피벗 유형(예: 피보나치, 카마릴라)과 피벗 시간 프레임(예: 일간, 월간)을 선택하세요.
- Number of Pivots Back를 조정하여 표시할 과거 세트를 제어하세요.
- 색상, 선 두께, 라벨 설정을 스타일에 맞게 맞춤 설정하세요.
- 피벗 수준을 사용하여 지지/저항을 식별하고, 손절매/이익실현을 설정하거나 돌파 거래를 하세요.
적합 대상:
- 데이 트레이더: 일간 또는 주간 피벗을 활용하여 인트라데이 진입 및 청산을 합니다.
- 스윙 트레이더: 월간 또는 분기별 피벗을 사용하여 장기 추세를 포착합니다.
- 스캘퍼: 더 낮은 시간 프레임과 결합하여 빠르고 정확한 거래를 합니다.
- 모든 시장: 외환, 주식, 암호화폐, 원자재 등 모든 시장에서 원활하게 작동합니다.
거래 자신감 향상
Pivot Points Standard를 사용하면 기술 분석을 단순화하고 높은 확률의 거래 기회를 포착하는 능력을 향상시키는 강력한 올인원 도구에 접근할 수 있습니다. 초보자든 경험 많은 트레이더든 이 지표는 전략에 맞게 조정되어 명확하고 실행 가능한 수준을 제공하여 거래 실력을 향상시킵니다. 오늘 Pivot Points Standard를 사용해 보시고 정밀하고 명확한 거래를 직접 경험하세요! 일회성 결제, 평생 접근, 향후 업데이트 포함.
요약
AI 요약
Pivot Point Daily Indicator is a multi-timeframe pivot point tool designed for the cTrader platform. It supports six pivot calculation methods—Classic, Fibonacci, Woodie, Camarilla, DM, and Traditional—each offering various resistance and support levels (up to R5/S5 for some methods). Users can select from a broad range of timeframes including Auto, Daily, Weekly, Monthly, Quarterly, Yearly, and multi-year intervals, allowing alignment with different trading horizons.
The indicator allows displaying up to 200 historical pivot sets to analyze past price interactions while maintaining chart clarity through customizable label positions and line settings. It offers options to use daily-based or intraday data, enhancing flexibility for diverse trading strategies.
Pivot Point Daily Indicator is optimized for real-time performance with native cTrader coding, compatible across Forex, indices, commodities, cryptocurrencies, and other markets. Its interface includes intuitive dropdown menus for pivot type, timeframe, and label customization.
Traders can use this indicator to identify key support and resistance levels, trend directions, and breakout opportunities, aiding in setting stop-loss and take-profit points. It suits various trading styles including day trading, swing trading, and scalping across multiple asset classes.
지표 프로필
지표 카테고리
지지 및 저항
출력 유형
필터
데이터 요구 사항
막대만
지원되는 신호
레벨 돌파
고객 리뷰
4.2
리뷰: 4
5 | 25 % | |
4 | 75 % | |
3 | 0 % | |
2 | 0 % | |
1 | 0 % |
고객 리뷰
May 2, 2026
Bought it, added it, used it for a while, and now it's disappeared, and I cannot get it back!
August 28, 2025
Good helper for review if the trader wants it keeps attention on levels that actually matter. It works best as support, not a final decision maker. The cleanest use is 3 to 5 levels per chart, with 0.5 pullbacks checked before entry. not every zone holds, even if it looks clean.
August 27, 2025
August 27, 2025
Usable tool with purpose for traders who build plans around market levels. It gives value around key price zones, but not every zone holds, even if it looks clean. I would wait for 2 reactions and avoid trades where the target is less than 1.5R. Levels are useful when they reduce noise, not when they crowd the chart.
상담
자주 묻는 질문(FAQ)
Fibonacci
Prop
Forex
Breakout
Indices
Commodities
트레이딩 봇, 지표, 플러그인 등 cTrader Store에서 제공되는 상품은 제3자 개발자에 의해 제공되며, 이는 단순히 정보 및 기술적 접근을 목적으로 제공된 것입니다. cTrader Store는 중개인이 아니며, 투자 조언, 개인별 추천 또는 향후 성과에 대한 어떠한 보장도 제공하지 않습니다.


가격
가입일 30/05/2025
40
판매