

설명
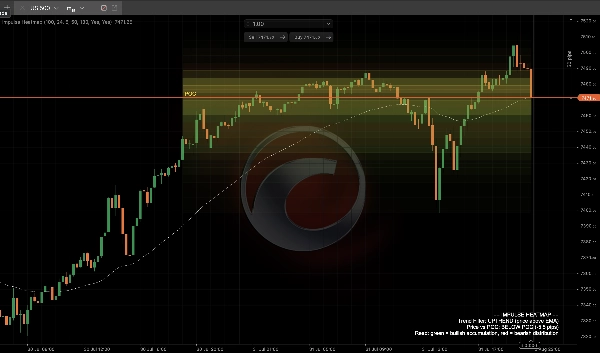
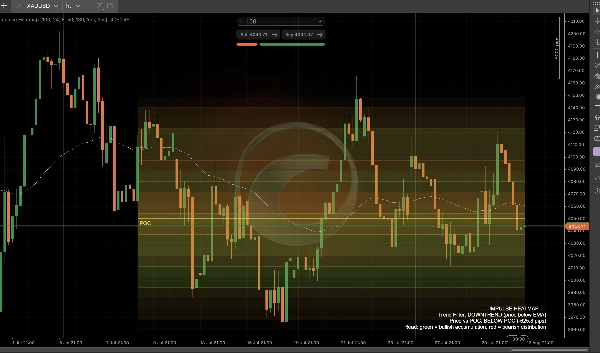
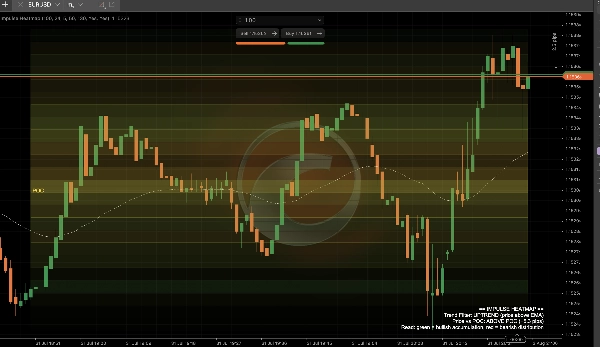
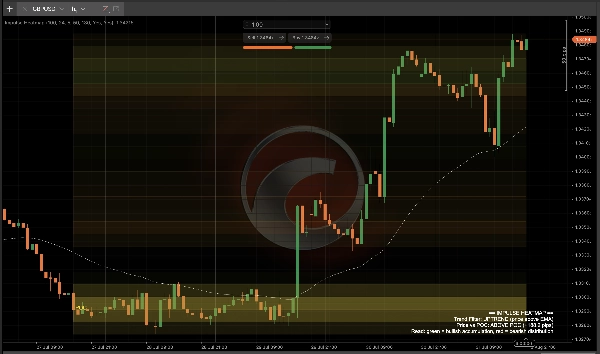
볼륨 히트맵은 지금 어디에나 있지만, 거의 모두 같은 것을 보여줍니다: 강도만, 한 가지 색상, 그 볼륨이 매수인지 매도인지에 대한 감각이 없습니다. 임펄스 히트맵은 빠진 조각을 더합니다 — 모든 가격 구역이 단순한 밀도뿐만 아니라 방향에 따라 색상이 혼합되어 한눈에 축적과 분배를 구분할 수 있습니다.
분석 대상: 롤링 룩백 윈도우를 통한 틱 볼륨으로, 표준 볼륨 프로필과 같은 방식으로 가격 구간에 분포됩니다 — 단, 각 구간의 색상은 해당 가격에서 강세 마감 캔들과 약세 마감 캔들에서 나온 볼륨의 비율에 따라 혼합됩니다. 대부분 강세 볼륨인 구역은 녹색으로 빛나며(축적), 대부분 약세 볼륨인 구역은 빨간색으로 빛나며(분배), 혼합된 구역은 그 중간에 위치합니다.
읽는 방법:
- 밝고 채도가 높은 구역 = 높은 볼륨 집중 — 시장이 가장 많은 시간과 크기를 보낸 가격 수준입니다.
- 녹색 빛이 도는 구역 = 해당 가격 수준이 주로 강세 압력으로 형성된 곳 — 잠재적 지지/축적 구역입니다.
- 빨간색 빛이 도는 구역 = 해당 가격 수준이 주로 약세 압력으로 형성된 곳 — 잠재적 저항/분배 구역입니다.
- 금색 POC 선 은 볼륨의 부드러운 무게 중심을 추적합니다 — 원시 포인트 오브 컨트롤 계산의 불안정함 없이 현재 진정한 "공정 가치" 자석이 위치한 곳입니다.
- 흰색 추세 필터 EMA 는 현재 히트 존이 지배적인 추세를 지지하는지 아니면 반대하는지에 대한 맥락을 제공합니다.
- 라이브 HUD 패널은 추세 상태와 가격이 POC에서 얼마나 떨어져 있는지(핍 단위)를 정확히 알려줍니다.
주요 설정: 룩백 윈도우 길이, 가격 구간 수(해상도), POC 부드럽게 하기, 추세 필터 EMA 기간, 그리고 강세/약세 혼합과 POC 선 모두에 대한 완전한 색상 맞춤 설정입니다.
일반적인 사용 사례: 지지/저항 구역이 단순한 원시 볼륨이 아닌 진정한 매수 또는 매도 압력으로 형성되었는지 확인; POC를 동적 공정 가치 자석으로 사용; 현재 수준의 볼륨이 지배적인 추세와 일치하는지 또는 모순되는지 확인; 자체 진입 모델과 결합하여 볼륨 맥락 필터로 사용.
가장 적합한 대상: 평면 볼륨 바나 단일 색상 히트맵 이상의 것을 원하는 외환 주요 통화, 금, 지수의 일중 거래자 — 독립적인 읽기용 또는 구조 기반 설정과 함께 사용할 때 유용합니다.
요약
AI 요약
Impulse Heatmap is a directional volume heatmap indicator designed to analyze tick volume distribution across price zones with a focus on volume direction—buying versus selling—rather than just volume intensity. It segments volume into price bins similar to a volume profile but colors each bin based on the proportion of bullish-closing versus bearish-closing candle volume. Zones with predominantly bullish volume appear green, indicating accumulation or potential support, while zones with mostly bearish volume appear red, indicating distribution or potential resistance. Mixed zones show blended colors.
Key features include:
- Bright, saturated zones highlighting high volume concentration price levels.
- A gold Point of Control (POC) line representing a smoothed volume center of gravity as a dynamic fair value reference.
- A white trend filter EMA providing context on whether volume zones align with or oppose the prevailing trend.
- A live HUD panel displaying trend state and price distance from the POC in pips.
- Customizable settings for lookback window, price bin resolution, POC smoothing, trend filter EMA period, and color schemes.
Impulse Heatmap is suited for intraday traders focusing on forex majors, gold, and indices who require enhanced volume context to distinguish genuine buying or selling pressure at key support and resistance levels. It can be used standalone or combined with other structural or entry models.
Key features include:
- Bright, saturated zones highlighting high volume concentration price levels.
- A gold Point of Control (POC) line representing a smoothed volume center of gravity as a dynamic fair value reference.
- A white trend filter EMA providing context on whether volume zones align with or oppose the prevailing trend.
- A live HUD panel displaying trend state and price distance from the POC in pips.
- Customizable settings for lookback window, price bin resolution, POC smoothing, trend filter EMA period, and color schemes.
Impulse Heatmap is suited for intraday traders focusing on forex majors, gold, and indices who require enhanced volume context to distinguish genuine buying or selling pressure at key support and resistance levels. It can be used standalone or combined with other structural or entry models.
지표 프로필
지표 카테고리
추세
출력 유형
신호
시각화
데이터 요구 사항
막대만
틱 데이터
지원되는 신호
돌파
반전
추세 강도
변동성
시가 범위
다이버전스
상담
고객 리뷰
0.0
리뷰: 0
고객 리뷰
이 상품에 대한 리뷰가 아직 없습니다. 이미 사용해 보셨나요? 다른 사람들에게 가장 먼저 소개해 주세요!
자주 묻는 질문(FAQ)
EMA
Key Levels
AI-assisted
BOS
Volume
Market Structure
Support & Resistance
트레이딩 봇, 지표, 플러그인 등 cTrader Store에서 제공되는 상품은 제3자 개발자에 의해 제공되며, 이는 단순히 정보 및 기술적 접근을 목적으로 제공된 것입니다. cTrader Store는 중개인이 아니며, 투자 조언, 개인별 추천 또는 향후 성과에 대한 어떠한 보장도 제공하지 않습니다.
이 작성자의 상품 더 보기






























가격

가입일 07/05/2026
6
판매
63
무료 설치