
설명
⚡ 주요 특징
- 동적 영역 감지
-
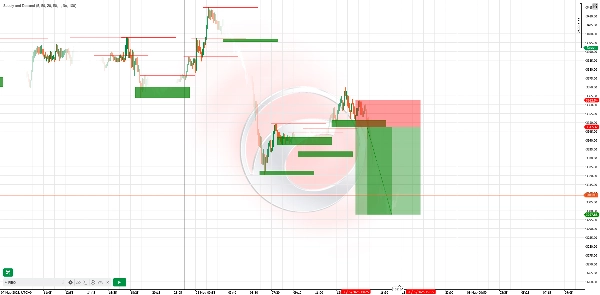
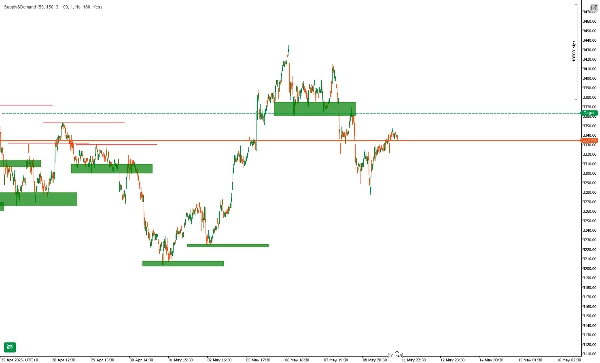
- 스윙 고점/저점을 자동으로 감지하고 실시간으로 공급(저항) 및 수요(지지) 영역을 그립니다.
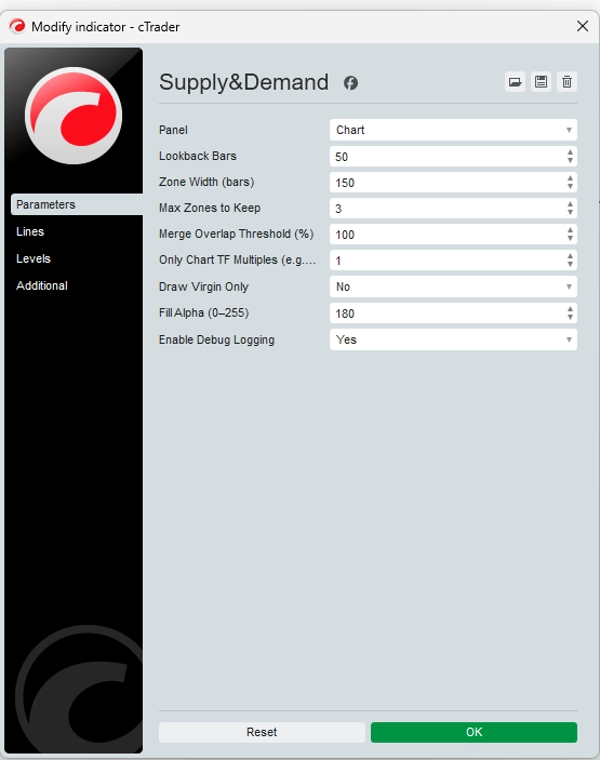
- 구성 가능한 조회 및 영역 너비 매개변수를 통해 모든 시장이나 시간대에 맞게 민감도를 조정할 수 있습니다.
- 버진 영역 강조
-
- 가격에 한 번도 닿지 않은 신선한 “버진” 영역을 시각적으로 강조하여 기관이 주문을 남긴 곳에서 거래할 수 있습니다.
- 선택적으로 터치된 영역을 숨겨 차트를 깔끔하게 유지할 수 있습니다.
- 다중 시간대 필터링
-
- 차트의 시간대 배수와 일치하는 영역만 표시합니다(예: 1시간 차트에 일간 영역 표시).
- 상위 시간대 공급/수요와 일중 설정의 합류를 빠르게 확인할 수 있습니다.
- 비재도색 및 비지연
-
- 영역은 한 번 그려지면 고정되어 가격 이동 후 사라지거나 이동하는 선이 없습니다.
- 백테스트된 신뢰성: 영역은 고정되어 과거 분석에 대한 신뢰를 제공합니다.
- 맞춤 알림 및 로깅
-
- 가격이 영역에 진입하거나 돌파할 때 팝업 또는 이메일 알림을 받습니다.
- 상세 디버그 로그는 영역 생성, 중복 건너뛰기 및 영역 터치를 보여줍니다.
🚀 작동 원리
- 피벗 감지: 지표는 선택한 조회 기간을 기준으로 각 새 바에서 피벗 고점(공급)과 피벗 저점(수요)을 스캔합니다.
- 영역 구성: 각 피벗마다 기관이 제한 주문을 배치했을 가능성이 높은 영역을 앞으로 확장하는 직사각형 영역을 그립니다.
- 중복 필터링: 임계값을 초과하는 중복 영역은 병합하거나 건너뛰어 가장 중요한 영역만 남도록 합니다.
- 버진 전용 옵션: 손대지 않은 영역만 표시하여 가장 신선한 기관 수준에 집중할 수 있습니다.
🎯 예시 거래 전략
전략시간대진입손절익절
영역 거부
H1
가격이 수요 영역으로 반등하고 공급 영역에서 약세 캔들(엔골핑/핀 바)을 보일 때까지 기다립니다.
영역 경계 바로 너머
영역 높이의 1.5배
시간대 합류
M15 + H4
H4 수요 영역을 식별한 후 M15로 전환하여 해당 영역 내 강세 모멘텀 캔들을 찾습니다.
H4 영역 저점 아래
다음 H4 스윙 고점
돌파 및 재테스트
H4
가격이 공급 영역을 돌파한 후 영역 하단 재테스트와 약세 확인을 기다립니다.
영역 상단 위
최근 H4 저점
사용 팁: 영역 내에서 RSI 또는 MACD 다이버전스와 결합하여 더 높은 확률의 신호를 얻으세요.
📈 실제 사례
- EURUSD H4에서 지표가 1.0950–1.0980 구간에 수요 영역을 그립니다.
- 가격이 영역으로 하락하고 M15 강세 엔골핑 캔들을 형성합니다.
- 진입은 1.0970, 손절은 1.0945(영역 아래), 목표는 1.1040(다음 H4 저항)입니다.
- 결과: +70 핍 (~6.4배 위험 대비 수익).
⚠️ 면책 조항
이 지표는 도구일 뿐 보장된 수익 시스템이 아닙니다. 과거 성과가 미래 결과를 보장하지 않습니다. 항상 적절한 위험 관리를 사용하고(예: 거래당 최대 2%), 먼저 데모 계정에서 테스트하며 자신의 분석과 결합하세요. 거래에는 손실 위험이 있으므로 감당할 수 있는 자본으로만 거래하세요.
요약
AI 요약
Supply&Demand is a trading indicator that automatically identifies and plots key supply (resistance) and demand (support) zones on price charts in real time. It detects swing highs and lows using configurable lookback and zone-width settings, adapting to any market or timeframe. The indicator highlights “virgin” zones—areas untouched by price—emphasizing potential institutional order levels, with an option to hide touched zones for chart clarity.
It supports multi-timeframe filtering, allowing users to display zones aligned with higher timeframe multiples on lower timeframe charts, facilitating confluence analysis. Zones are non-repainting and non-lagging; once drawn, they remain fixed, ensuring reliable historical analysis. Custom alerts notify users when price enters or breaks these zones, and detailed logs track zone creation and interactions.
The indicator operates by scanning each new bar for pivot highs and lows, constructing rectangular zones extending forward, and filtering overlapping zones to retain the most significant areas. It offers a “virgin-only” mode to focus on fresh institutional levels.
Example strategies include zone rejection, multi-timeframe confluence, and break & retest setups, often combined with RSI or MACD divergence for higher-probability signals. A real-world example on EURUSD H4 demonstrates entry, stop-loss, and take-profit placement based on demand zones and candlestick confirmation.
지표 프로필
고객 리뷰
4.7
리뷰: 4
5 | 75 % | |
4 | 25 % | |
3 | 0 % | |
2 | 0 % | |
1 | 0 % |
고객 리뷰
November 9, 2025
A solid Supply & Demand tool - clear zones, stable performance, and visually neat. Great for spotting imbalances and retracement entries. Would love built-in alerts, but overall it’s a reliable companion for swing and intraday setups.
May 23, 2025
The main upside is low quality setups lose some appeal. It can look better than it is during a lucky run.
May 18, 2025
The first 10 trades should stay boring, and unclear signals stop looking so clean.
May 15, 2025
상담
자주 묻는 질문(FAQ)
EURUSD
RSI
MACD
트레이딩 봇, 지표, 플러그인 등 cTrader Store에서 제공되는 상품은 제3자 개발자에 의해 제공되며, 이는 단순히 정보 및 기술적 접근을 목적으로 제공된 것입니다. cTrader Store는 중개인이 아니며, 투자 조언, 개인별 추천 또는 향후 성과에 대한 어떠한 보장도 제공하지 않습니다.


가격
가입일 22/11/2024
133
판매
2.58K
무료 설치