

DARK POLL SIGNAL_noSourceCode
Indicador
1 compras
Versión 1.0, Mar 2025
Windows, Mac
4.5
Valoraciones: 4

Desde 20/09/2024
138
Ventas
16.97K
Instalaciones gratis
Descripción
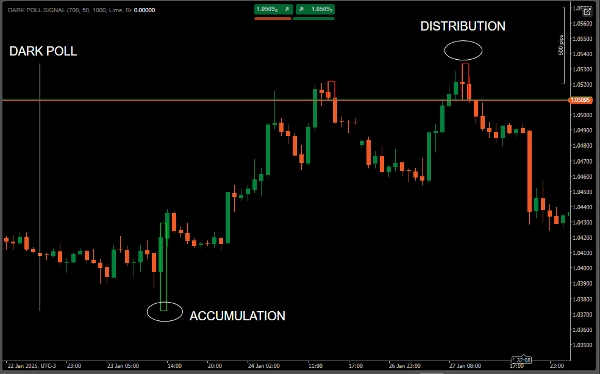
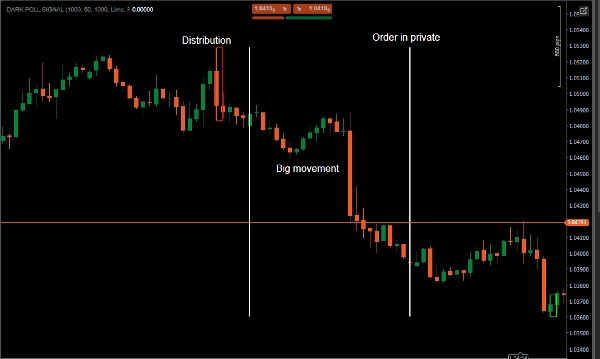
En la señal de dark pool donde precede a los grandes movimientos, en particular, después de la acumulación puede comenzar una tendencia alcista. Y después de la distribución una tendencia bajista.
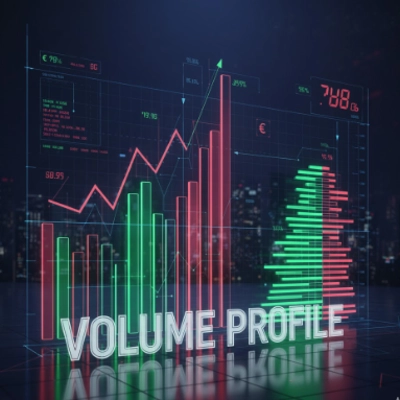
1-Volumen de Dark Pool: Si el volumen de ticks es bajo, se muestra un histograma blanco, que es una fuga de liquidez.
2-El indicador verifica la consolidación significativa de volumen y precio.
Si se detecta, dibuja un rectángulo en el área correspondiente.
Dibujo:
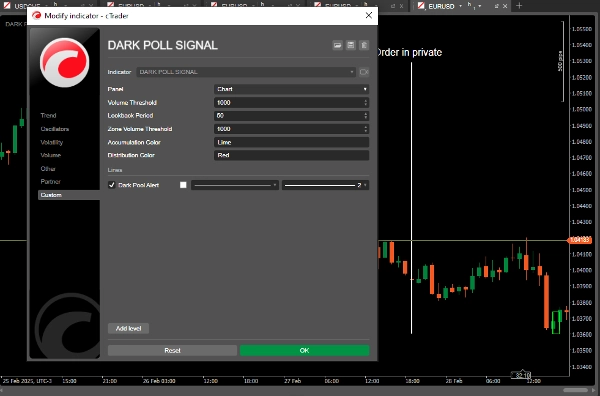
Las zonas de acumulación se resaltan en verde.
Las zonas de distribución se resaltan en rojo.
Este indicador combinado permite monitorear tanto la actividad de Dark Pool como las zonas de acumulación/distribución en un solo panel.
Resumen
AI summary
The DARK POLL SIGNAL indicator monitors Dark Pool volume and identifies key accumulation and distribution zones to anticipate significant market movements. It analyzes tick volume, displaying a white histogram to indicate liquidity leaks when volume is low. The indicator detects areas of significant volume and price consolidation, marking these zones with rectangles: green for accumulation and red for distribution. This visual representation helps users track potential upward trends following accumulation phases and downward trends after distribution phases. By combining Dark Pool activity with accumulation and distribution zone detection in a single panel, the indicator provides a consolidated view of market liquidity and price behavior.
Perfil del indicador
Valoraciones de clientes
4.5
Valoraciones: 4
5 | 50 % | |
4 | 50 % | |
3 | 0 % | |
2 | 0 % | |
1 | 0 % |
Valoraciones de clientes
March 10, 2025
March 5, 2025
it earns a spot because one quick look is not enough, and a 5 minute check should not become a 30 minute rabbit hole.
March 5, 2025
The logic holds up when the trade idea gets slowed down first, and two sessions say more than one clean chart.
Conversación
Preguntas frecuentes
Signal
Los productos disponibles a través de cTrader Store, incluidos bots, indicadores y plugins para operar, son proporcionados por desarrolladores de terceros y están disponibles únicamente con fines informativos y de acceso técnico. cTrader Store no es un bróker, por lo que no proporciona asesoramiento de inversión, recomendaciones personales ni ninguna garantía de rentabilidad futura.





















Precio
Desde 20/09/2024
138
Ventas
16.97K
Instalaciones gratis