

Tradingfcs_vwap
อินดิเคเตอร์
เวอร์ชัน 1.0, Oct 2026
Windows, Mac
4.0
รีวิว: 1

ตั้งแต่ 05/07/2026
38.9M
ปริมาณการเทรด
327.09K
Pips ที่ได้กำไร
คำอธิบาย
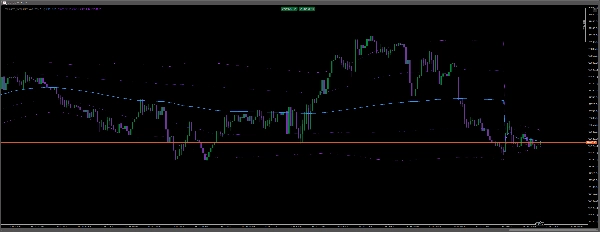
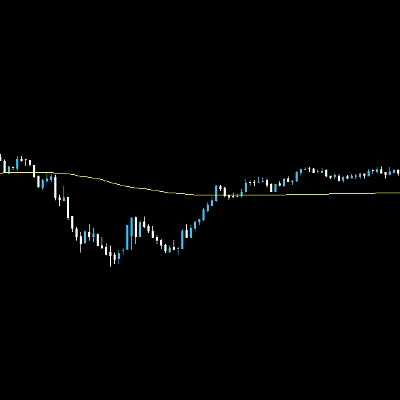
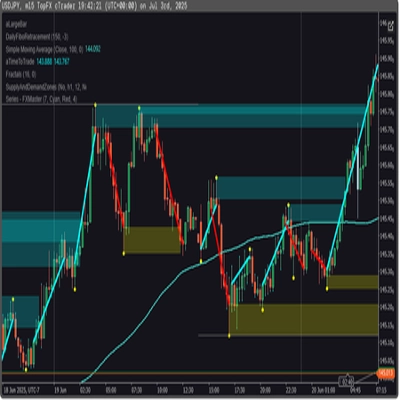
- 🔵 เส้น VWAP สีน้ำเงิน: แสดงราคาซื้อขายเฉลี่ยถ่วงน้ำหนักด้วยปริมาณ ช่วยระบุทิศทางตลาดในวันเดียวกันและแนวรับหรือแนวต้านแบบไดนามิก
- 🟣 แถบเบี่ยงเบนสีม่วง: เน้นพื้นที่ที่ราคาขยับออกจากค่าเฉลี่ย ช่วยให้เทรดเดอร์ระบุโอกาสที่อาจเกิดการขยายตัวเกินและการกลับตัว
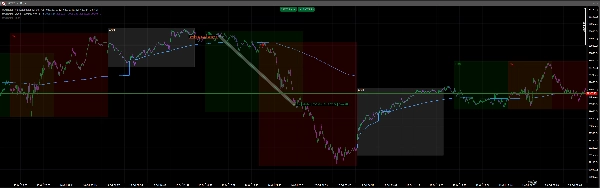
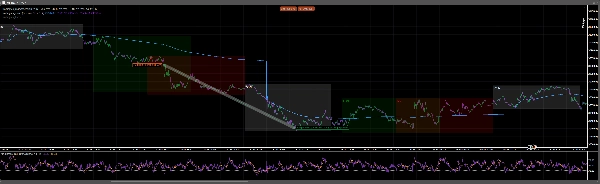
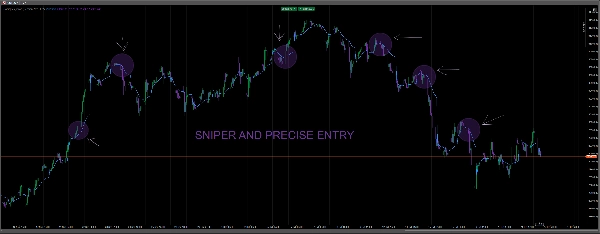
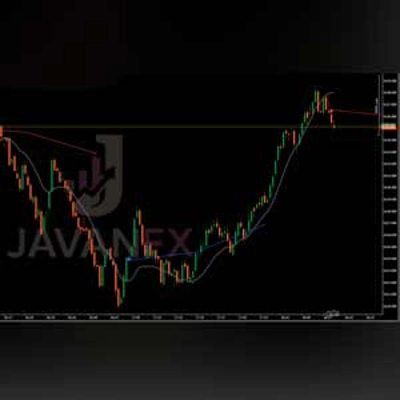
- 📈 การปฏิเสธราคา: กราฟ H1 ที่เน้นแสดงให้เห็นว่าปฏิกิริยาของราคารอบๆ VWAP สามารถนำหน้าการเคลื่อนไหวแบบขาขึ้นหรือขาลงได้อย่างไร
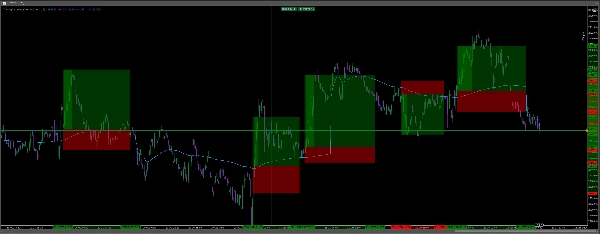
⏰ ช่วงเวลาการซื้อขาย: การซ้อนทับช่วงเวลาที่แยกต่างหากของคุณช่วยระบุช่วงการซื้อขายในเอเชีย ลอนดอน และนิวยอร์ก ช่วยให้คุณประเมินโอกาสในสภาวะตลาดที่แตกต่างกัน
----------------------------------
วิธีที่ช่วยให้เทรดเดอร์ค้นหาโอกาส
🟢 โอกาสซื้อ: เมื่อราคายืนเหนือ VWAP และทดสอบซ้ำสำเร็จในฐานะแนวรับ เทรดเดอร์สามารถมองหาการต่อเนื่องของแนวโน้มขาขึ้น
🔴 โอกาสขาย: เมื่อราคาซื้อขายต่ำกว่า VWAP และปฏิเสธในฐานะแนวต้าน เทรดเดอร์สามารถระบุการต่อเนื่องของแนวโน้มขาลงที่เป็นไปได้
⚡ การสแคปปิ้งที่แม่นยำ: ในกรอบเวล M1 และ M5 VWAP ช่วยให้เทรดเดอร์ระบุจุดเข้า การดึงกลับ และจุดออกโดยใช้การเคลื่อนไหวของราคาและการยืนยันโมเมนตัม
สรุป
สรุปโดย AI
Tradingfcs_vwap is a technical indicator designed to assist traders in identifying intraday market trends and potential trade entries using the Volume Weighted Average Price (VWAP). It features a blue VWAP line that reflects the average trading price weighted by volume, serving as a dynamic support or resistance level. Purple deviation bands highlight price movements away from the VWAP, indicating possible overextensions and reversal points.
The indicator also visualizes price rejections on the hourly chart, showing how price interactions with the VWAP can signal bullish or bearish moves. Separate overlays mark the Asian, London, and New York trading sessions, enabling traders to assess market behavior across different periods.
Key trading signals include:
- Buy opportunities when price holds above VWAP and retests it as support.
- Sell opportunities when price trades below VWAP and rejects it as resistance.
- Precision scalping on 1- and 5-minute timeframes by identifying entries, pullbacks, and exits through price action and momentum confirmation.
This tool supports analysis based on volume, support and resistance, and trend strength, using bar data inputs and providing signal outputs for enhanced decision-making in various trading styles.
The indicator also visualizes price rejections on the hourly chart, showing how price interactions with the VWAP can signal bullish or bearish moves. Separate overlays mark the Asian, London, and New York trading sessions, enabling traders to assess market behavior across different periods.
Key trading signals include:
- Buy opportunities when price holds above VWAP and retests it as support.
- Sell opportunities when price trades below VWAP and rejects it as resistance.
- Precision scalping on 1- and 5-minute timeframes by identifying entries, pullbacks, and exits through price action and momentum confirmation.
This tool supports analysis based on volume, support and resistance, and trend strength, using bar data inputs and providing signal outputs for enhanced decision-making in various trading styles.
โปรไฟล์อินดิเคเตอร์
หมวดหมู่อินดิเคเตอร์
แนวรับและแนวต้าน
ประเภทเอาต์พุต
สัญญาณ
ข้อกำหนดด้านข้อมูล
แท่งเท่านั้น
สัญญาณที่รองรับ
ความแข็งแกร่งของแนวโน้ม
การสนทนา
รีวิวจากลูกค้า
4.0
รีวิว: 1
5 | 0 % | |
4 | 100 % | |
3 | 0 % | |
2 | 0 % | |
1 | 0 % |
รีวิวจากลูกค้า
October 22, 2026
VWAP and deviation bands give the H1 rejection examples a clear reference. Session overlays add timing, and the description distinguishes holding above the average from rejecting below it. A useful context view rather than one mechanical rule for every band touch.
คำถามที่พบบ่อย
VWAP
Support & Resistance
ผลิตภัณฑ์ที่มีให้บริการผ่าน cTrader Store รวมถึงบอทการเทรด อินดิเคเตอร์ และปลั๊กอิน มีให้บริการโดยนักพัฒนาบุคคลที่สามและมีไว้เพื่อวัตถุประสงค์ในการเข้าถึงข้อมูลและทางเทคนิคเท่านั้น cTrader Store ไม่ใช่โบรกเกอร์และไม่ได้ให้คำแนะนำการลงทุน คำแนะนำส่วนบุคคล หรือการรับประกันผลการดำเนินงานในอนาคต







ราคา
ตั้งแต่ 05/07/2026
38.9M
ปริมาณการเทรด
327.09K
Pips ที่ได้กำไร