
คำอธิบาย
วัตถุประสงค์หลัก:
แผนที่การกระจายปริมาณตามระดับราคาเพื่อระบุ:
พื้นที่สภาพคล่องสูง
พื้นที่สภาพคล่องต่ำ
ความไม่สมดุลระหว่างผู้ซื้อและผู้ขาย
ตัวบ่งชี้นี้มีประสิทธิภาพในการเข้าใจโครงสร้างตลาดและระบุพื้นที่ที่มีความน่าจะเป็นสูงสำหรับการดำเนินการ! 🎯
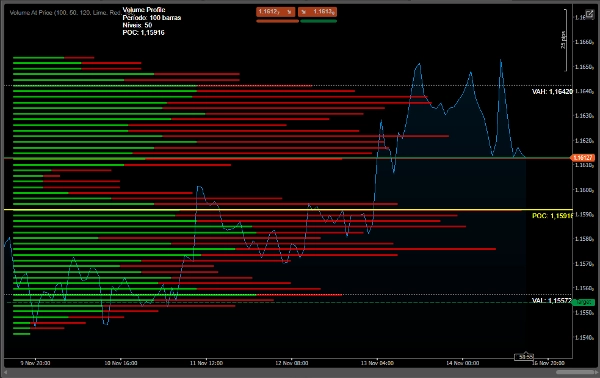
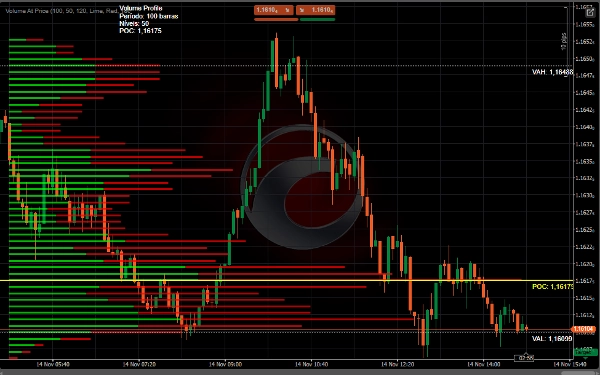
1. POC (จุดควบคุม)
Linha Amarela - ราคาที่มีปริมาณการซื้อขายสูงสุด
พื้นที่ที่มีสภาพคล่องและราคาสูงสุด
แนวรับ/แนวต้านตามธรรมชาติ
2. พื้นที่มูลค่า
เส้นสีขาว - พื้นที่ที่มีการซื้อขายปริมาณ 70%
VAH (Value Area High) - ขอบเขตบน
VAL (Value Area Low) - ขอบเขตล่าง
โซนสมดุลของตลาด
3. แกนของปริมาณ
🟢 สีเขียว - ปริมาณการซื้อที่โดดเด่น
🔴 Vermelho - ปริมาณการขายที่โดดเด่น
ความยาวแท่ง = ความเข้มข้นของปริมาณ
📊 ใช้กลยุทธ์
1. การระบุแนวรับและแนวต้าน
• POC ทำหน้าที่เป็นแนวรับ/แนวต้านแบบไดนามิก
• พื้นที่มูลค่ากำหนดโซนสมดุล
• ขอบโปรไฟล์ S/R ที่สำคัญ
2. การวิเคราะห์การเบรคเอาท์
• เบรคเหนือ VAH → แนวโน้มขาขึ้น
• เบรคต่ำกว่า VAL → แนวโน้มขาลง
• ปริมาณที่ไม่เบรคยืนยันการเคลื่อนไหว
3. จุดเข้า
• ซื้อ: ทดสอบ VAL อีกครั้งพร้อมปริมาณผู้ซื้อ
• ขาย: ทดสอบ VAH อีกครั้งพร้อมปริมาณผู้ขาย
• Fade: ดำเนินการตรงข้ามกับขอบเขตของโปรไฟล์
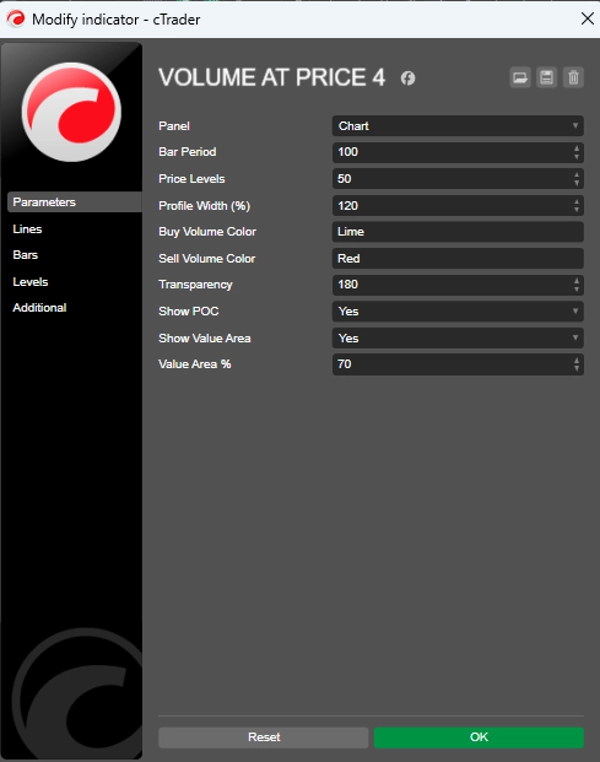
⚙️ การตั้งค่าที่แนะนำ
สำหรับการเทรดรายวัน
csharp
ช่วงเวลา = 50-100
ระดับราคา = 50
ความกว้างโปรไฟล์ = 120%
เปอร์เซ็นต์พื้นที่มูลค่า = 70
สำหรับการเทรดสวิง
csharp
ช่วงเวลา = 100-200
ระดับราคา = 80
ความกว้างโปรไฟล์ = 150%
เปอร์เซ็นต์พื้นที่มูลค่า = 70
✅ ข้อดี:
ระบุแนวรับ/แนวต้านแบบไดนามิก
แสดงเจตนาตลาด (ปริมาณ)
เผยพื้นที่สภาพคล่องที่สำคัญ
การแสดงภาพความไม่สมดุลอย่างชัดเจน
นับจำนวนเทียนปริมาณปัจจุบัน
สรุป
- Point of Control (POC): The price level with the highest traded volume, acting as a dynamic support or resistance.
- Value Area: The price range where 70% of volume is traded, defined by Value Area High (VAH) and Value Area Low (VAL), representing market balance zones.
- Volume Cores: Colored bars indicating dominant buying (green) or selling (red) volume, with bar length reflecting volume intensity.
The indicator supports strategies like identifying support and resistance levels, breakout analysis (trend direction based on VAH and VAL breaks), and entry points (buy near VAL with buyer volume, sell near VAH with seller volume, or fade at profile extremes).
Recommended settings vary by trading style: for day trading, shorter periods and narrower profiles; for swing trading, longer periods and wider profiles. This tool aids in visualizing liquidity, market intent, and volume imbalances to inform trading decisions.
รีวิวจากลูกค้า
5 | 0 % | |
4 | 50 % | |
3 | 50 % | |
2 | 0 % | |
1 | 0 % |


