
คำอธิบาย
Market Cipher A เป็นตัวบ่งชี้ทางเทคนิคขั้นสูงที่ออกแบบมาเพื่อการวิเคราะห์ การระบุ และการทำนายแนวโน้มขนาดใหญ่ในตลาดสกุลเงินดิจิทัลได้อย่างง่ายดาย
โครงสร้างและส่วนประกอบ
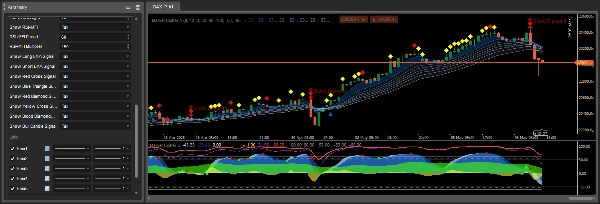
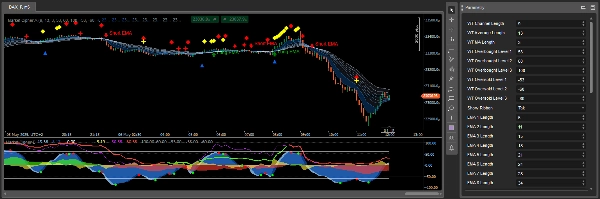
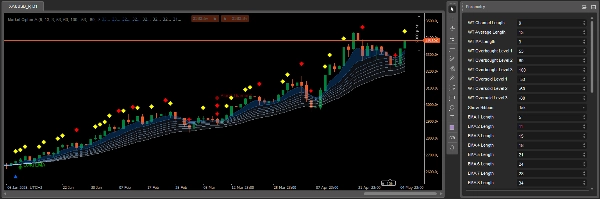
Market Cipher A ประกอบด้วยริบบิ้นของค่าเฉลี่ยเคลื่อนที่เลขชี้กำลัง (EMA) จำนวน 8 เส้นที่เปลี่ยนสีขึ้นอยู่กับแนวโน้มของตลาด ริบบิ้น EMA จะเปลี่ยนเป็นสีน้ำเงินหรือสีขาวในช่วงตลาดกระทิง และสีเทาในช่วงตลาดหมี
โดยค่าเริ่มต้นจะใช้ค่าเฉลี่ยเคลื่อนที่ที่มีค่า EMA ตั้งแต่ 5 ถึง 34 การตัดกันของเส้นเหล่านี้อาจเป็นตัวบ่งชี้ที่ล่าช้าอย่างมาก ซึ่งเป็นเหตุผลที่ Market Cipher A ได้ถูกตั้งโปรแกรมให้แสดงสัญลักษณ์ที่สอดคล้องกับสัญญาณต่าง ๆ โดยอัตโนมัติ ช่วยขจัดความจำเป็นในการตีความด้วยตนเองสำหรับการตัดกันแบบกระทิงหรือหมีแต่ละครั้ง
สัญลักษณ์และสัญญาณการซื้อขาย
Market Cipher A แสดงสัญลักษณ์เฉพาะบนกราฟแท่งเทียนโดยตรงที่บ่งชี้โอกาสในการซื้อขายที่เป็นไปได้:
สามเหลี่ยมสีน้ำเงิน - สัญญาณการกลับตัวของแนวโน้ม บ่งชี้ถึงแรงขับเคลื่อนที่ลดลงและการกลับตัวที่ใกล้เข้ามา เป็นการเตือนล่วงหน้าว่าแรงขับเคลื่อนของแนวโน้มกำลังลดลง
วงกลมสีเขียว - ตัวบ่งชี้กระทิงที่น่าเชื่อถือที่สุดในกรอบเวลาหกชั่วโมงขึ้นไป โดยทั่วไปจะปรากฏหลังจากสามเหลี่ยมสีน้ำเงินและควรตีความภายในช่วง 1-3 แท่งเทียน
เพชรสีเหลือง - บ่งชี้การดำเนินแนวโน้มขาขึ้น ควรใช้ร่วมกับริบบิ้น EMA เพื่อยืนยันทิศทางแนวโน้มได้ดียิ่งขึ้น
เพชรสีแดง - สัญญาณว่าแนวโน้มอ่อนแรงและอาจดำเนินต่อไปในทิศทางขาลง บ่งชี้แรงขับเคลื่อนด้านลบที่เพิ่มขึ้น
กากบาทสีแดง - ตัวบ่งชี้ตลาดหมีที่มีประสิทธิภาพที่สุดในกรอบเวลา 1 ชั่วโมงขึ้นไป ควรใช้ร่วมกับริบบิ้น EMA และเพชรสีแดง
กากบาทสีเหลือง - บ่งชี้การจัดการตลาด โดยเฉพาะการปิดสถานะซื้อขนาดใหญ่ที่ถูกซื้อและขายอย่างรวดเร็วโดยสถานะขาย
เพชรสีแดงขนาดใหญ่ (Blood Diamond) - สัญญาณตลาดหมีที่รุนแรงที่สุด บ่งชี้ความน่าจะเป็นสูงของการลดลง โดยเฉพาะเมื่อเกิดขึ้นพร้อมกับกากบาทสีแดงหรือเพชรสีแดงขนาดเล็กกว่า
หลักการใช้งาน
Market Cipher A ให้การสนับสนุนหรือแนวต้านทางคณิตศาสตร์ที่แข็งแกร่งในรูปแบบภาพ ช่วยให้เข้าใจสภาพแวดล้อมการซื้อขายได้ง่ายขึ้น ทำงานได้ดีที่สุดกับแท่งเทียน Heiken Ashi
ริบบิ้น EMA ไม่เพียงแต่บ่งชี้แนวโน้มเท่านั้น แต่ยังทำหน้าที่เป็นระดับแนวรับและแนวต้านแบบไดนามิก เมื่อริบบิ้นเป็นสีน้ำเงิน/ขาวและแท่งเทียนอยู่เหนือริบบิ้น คุณสามารถมองหาโอกาสในการเปิดสถานะซื้อ เมื่อริบบิ้นเป็นสีเทาและแท่งเทียนอยู่ต่ำกว่าริบบิ้น คุณสามารถพิจารณาสถานะขาย
ผลลัพธ์ที่ดีที่สุดจะเกิดขึ้นเมื่อสัญญาณจาก Market Cipher A ถูกผสมผสานกับตัวบ่งชี้อื่น ๆ จากชุด Market Cipher โดยเฉพาะ Market Cipher B ซึ่งให้สัญญาณแรงขับเคลื่อนเพิ่มเติมและจุดเข้า
การตีความสัญญาณอย่างละเอียดในบริบทของแนวโน้ม
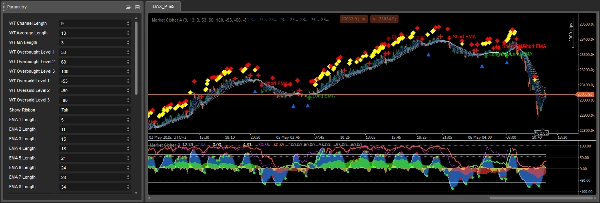
แง่มุมสำคัญของ Market Cipher A คือการตีความสัญญาณตามบริบทขึ้นอยู่กับแนวโน้มหลัก เมื่อริบบิ้นเปลี่ยนสีจากสีเทาเป็นสีน้ำเงิน ตัวบ่งชี้จะสร้างวงกลมสีเขียวเป็นสัญญาณเริ่มต้นของแนวโน้มขาขึ้น โดยปกติหลังจากวงกลมสีเขียว หากแท่งเทียน 1-3 แท่งถัดไปแสดงเพชรสีเหลือง ความน่าจะเป็นของการเบรกเอาต์จะสูง อย่างไรก็ตาม หากปรากฏเพชรสีแดง การเบรกเอาต์จะมีโอกาสน้อยลง
ในช่วงตลาดกระทิง เพชรสีเหลืองเป็นสัญญาณที่ดี แสดงถึงการดำเนินแนวโน้มขาขึ้นตามแนวโน้ม ขณะที่เพชรสีแดงแสดงถึงการเคลื่อนไหวสวนทางแนวโน้ม ในตลาดหมี สถานการณ์กลับกัน - เพชรสีแดงเป็นสัญญาณที่ดีในฐานะการดำเนินแนวโน้มขาลง และเพชรสีเหลืองบ่งชี้การเคลื่อนไหวขึ้นชั่วคราวที่สวนทางแนวโน้ม
กากบาทสีแดงน่าเชื่อถือที่สุดเมื่อปรากฏหลังจากเพชรสีแดงและริบบิ้น EMA แทบจะถูกบีบอัดจนเปลี่ยนเป็นสีเทาตลาดหมี ความแม่นยำของตัวบ่งชี้นี้แตกต่างกันไปตามกรอบเวลา
กลไกการทำงานและการเกิดสัญญาณ
สัญลักษณ์และสัญญาณใน Market Cipher A ถูกสร้างขึ้นจากหลายแหล่ง ได้แก่ การตัดกันของคลื่น WaveTrend ระดับซื้อมากและขายมาก และจาก RSI และ MFI เมื่อพวกมันตัดเส้นกลางหรือถึงระดับซื้อมากและขายมาก การวิเคราะห์หลายมิติทำให้สัญญาณมีความครอบคลุมมากกว่าตัวบ่งชี้เดี่ยว
ริบบิ้น EMA ประกอบด้วยค่าเฉลี่ยเคลื่อนที่ 8 เส้นที่สร้างริบบิ้นลักษณะเฉพาะโดยมีการแยกตัวระหว่างแถบแต่ละเส้น การแยกตัวของแถบเป็นปัจจัยสำคัญ - การแยกตัวกว้างบ่งชี้แนวโน้มที่แข็งแกร่ง ขณะที่แถบที่ถูกบีบอัดบ่งชี้แรงขับเคลื่อนที่อ่อนแรงหรือการรวมตัว
การประยุกต์ใช้ในกลยุทธ์การซื้อขาย
Market Cipher A ถูกออกแบบมาเป็นหลักเพื่อเป็นเครื่องมือวิเคราะห์แนวโน้ม ดังนั้นจึงทำงานได้ดีที่สุดในกลยุทธ์ที่ติดตามแนวโน้ม แนะนำให้ใช้ริบบิ้นร่วมกับตัวบ่งชี้การระบุแนวโน้มอื่น ๆ แล้วมองหาโอกาสซื้อขายในช่วงราคาย่อตัว
สิ่งสำคัญคือต้องจำไว้ว่าสัญญาณเหล่านี้ช่วยปรับจังหวะการเข้าและออกจากการซื้อขายให้แม่นยำขึ้น แต่ไม่ควรใช้เพียงลำพังในการตัดสินใจซื้อขาย จำเป็นต้องมีการยืนยันเพิ่มเติม โดยเฉพาะสำหรับสัญญาณกลับตัวที่เกิดขึ้นในช่วงราคาคงที่
สรุป
The indicator automatically displays distinct symbols on the price chart to signal potential trading opportunities:
- Blue Triangle: signals declining momentum and possible trend reversal.
- Green Circle: indicates a bullish trend start, most reliable on 6-hour timeframes and above.
- Yellow Diamonds: suggest continuation of an upward trend.
- Red Diamonds: indicate trend weakening and potential downward continuation.
- Red X: bearish signal effective on 1-hour timeframes and higher.
- Yellow X: points to market manipulation events.
- Large Red Diamond ("Blood Diamond"): strong bearish signal with high probability of decline.
Signals are generated using a combination of WaveTrend crossovers, RSI, and MFI indicators, providing multidimensional market analysis. Market Cipher A is optimized for use with Heiken Ashi candles and is best applied within trend-following strategies, ideally combined with other Market Cipher indicators for enhanced entry and momentum confirmation.
รีวิวจากลูกค้า
5 | 67 % | |
4 | 33 % | |
3 | 0 % | |
2 | 0 % | |
1 | 0 % |


