
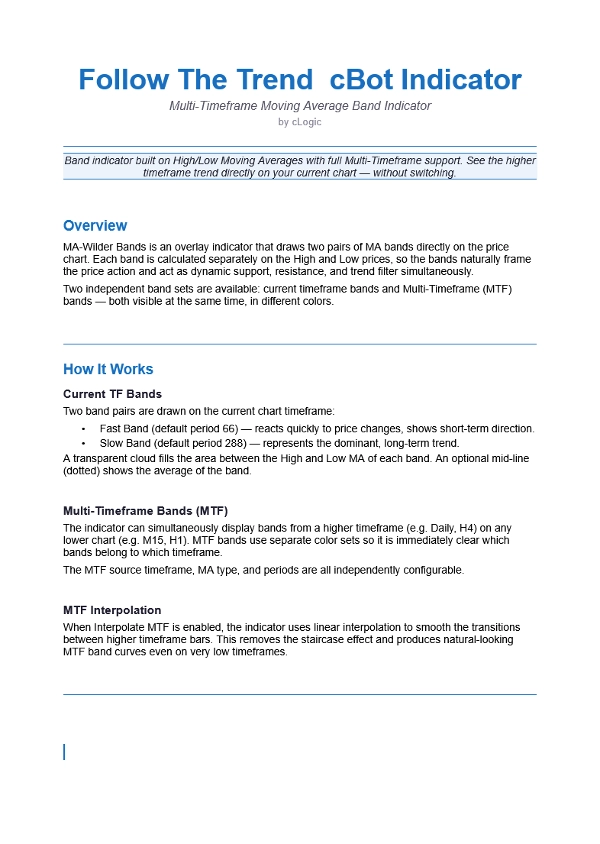
Descrizione
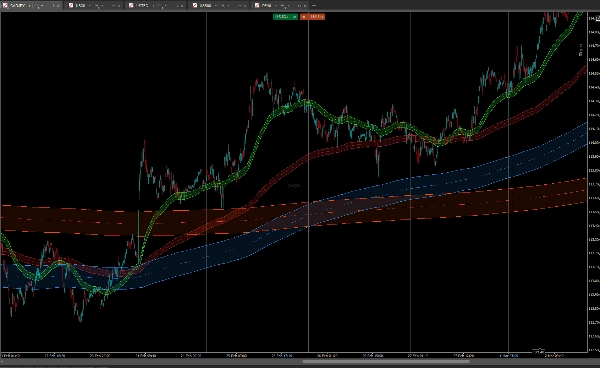
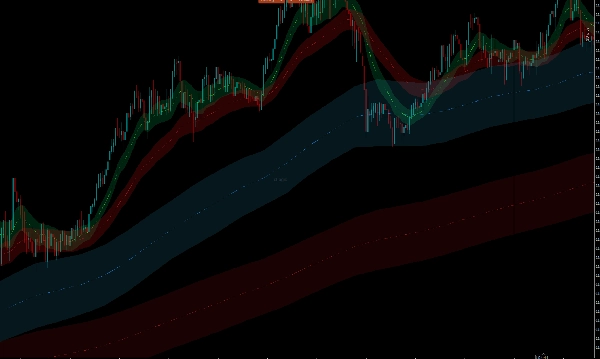
Follow The Trend è un indicatore sovrapposto che traccia due coppie di bande di Media Mobile sui prezzi High e Low — una Banda Veloce e una Banda Lenta — creando zone dinamiche di supporto e resistenza che incorniciano naturalmente l'azione del prezzo.
Il supporto Multi-Timeframe ti permette di visualizzare le bande da un timeframe superiore (ad esempio Daily, H4) direttamente sul tuo grafico attuale senza cambiare. Le bande MTF usano colori separati così entrambi i timeframe sono sempre visibili a colpo d'occhio.
L'interpolazione lineare ammorbidisce le transizioni tra le barre di timeframe superiore, eliminando l'effetto a gradini sui timeframe inferiori.
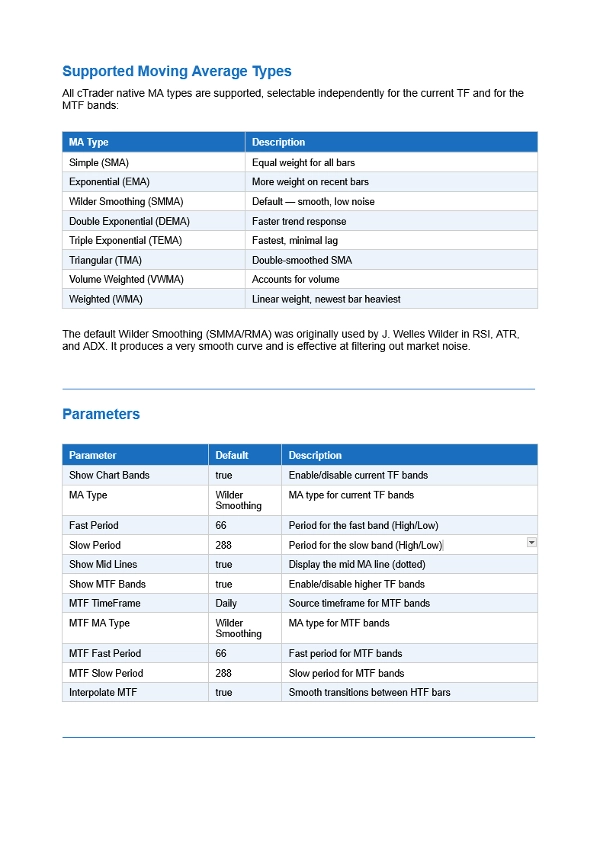
Sono supportati tutti e 8 i tipi di MA di cTrader — Semplice, Esponenziale, Wilder Smoothing, Doppio Esponenziale, Triplo Esponenziale, Triangolare, Ponderata per Volume e Ponderata — selezionabili indipendentemente per le bande del TF corrente e MTF.
Come leggerlo:
- Prezzo sopra entrambe le bande → trend rialzista
- Prezzo sotto entrambe le bande → trend ribassista
- Prezzo all'interno delle bande → consolidamento
- Aumento del divario tra Banda Veloce e Banda Lenta → accelerazione del trend
Puoi trovare questo robot cBot qui:
https://ctrader.com/products/3618?u=cLogic


