
คำอธิบาย
🚀 เทรดเดอร์กว่า 10,000 คนใช้ตัวชี้วัด TOP ของเราแล้ว 🏆
ค้นพบว่าทำไมมืออาชีพถึงเลือกเรา – เครื่องมือที่ทรงพลังที่สุดบน cTrader (ตัวชี้วัด, อัลกอริทึม และ cBots) กำลังรอคุณอยู่
👉 รับระบบ TOP ทั้งหมดของเราที่นี่:
📌 ตัวชี้วัดโครงสร้างตลาด
- ✅ โครงสร้างตลาดขั้นสูง: Bos, Choch, SwinLevels, Order Blocks, Market Structure & Liquidity Finder
- 🔄 การวิเคราะห์โครงสร้างตลาดแบบไดนามิกของจุดเปลี่ยน
- 🧱 Order Block
- ⚖️ ความไม่สมดุลของตลาด
- ⛓️ BOS & CHOCH
- 🧠 ICT Power of 3
- 🌀 โซนขั้วตลาด
🔚 ระบบออกอัจฉริยะ
📐 ตัวชี้วัด ZigZag
🧱 ตัวชี้วัดแนวรับและแนวต้าน
📊 ตัวชี้วัดแนวโน้มและช่องทาง
- 🔄 ช่องแนวโน้มอัตโนมัติ
- 📊 Supertrend
- 🧠 ช่องแนวโน้มปรับตัว
- 💥 ระบบเบรกเอาต์ช่องทาง
- 🌈 เกรเดียนต์แนวโน้มไดนามิก
- ⭐ PREMIUM SSL CHANNEL
- 🔁 ค่าเฉลี่ยเคลื่อนที่ตอบสนอง
💧 เครื่องมือปริมาณและสภาพคล่อง
- 🔥 แผนที่ความร้อน Volume POC
- 📉 แผนที่เลเวอเรจลิควิดเดชัน
- 🔍 ช่องว่างมูลค่ายุติธรรมโมเมนตัม
- 🕒 เซสชันช่องว่างมูลค่ายุติธรรม
⚡ ตัวชี้วัดโมเมนตัมและ RSI
🔮 เครื่องมือทำนายและคาดการณ์
- 📐 การทำนายโดยใช้ Linreg & ATR
- 📏 ฟีโบนักชีรีเกรสชันเชิงเส้นหลายกรอบเวลา
- 📈 โปรเจกเตอร์การไหลของตลาดที่ขับเคลื่อนด้วยปริมาณ
เครื่องวิเคราะห์แนวโน้มโมเมนตัม 🚀📊
อัลกอริทึมทางเทคนิคขั้นสูงที่ออกแบบมาเพื่อระบุ ทิศทางแนวโน้มตลาด และประเมิน ความแข็งแกร่ง โดยผสานรวมเมตริกการวิเคราะห์หลายตัว ตัวชี้วัดนี้รวม ค่าเฉลี่ยเคลื่อนที่เลขชี้กำลัง (EMAs), อัตราการเปลี่ยนแปลง (RoC), ความผันผวน, ความแข็งแกร่งสัมพัทธ์ และ ปริมาณ เพื่อส่งสัญญาณที่ชัดเจนและปฏิบัติได้ ด้านล่างนี้เราจะอธิบายฟังก์ชันการทำงานและตรรกะเบื้องหลังการคำนวณของมัน
ส่วนประกอบหลัก 🔧
อัลกอริทึมถูกสร้างขึ้นบน ห้าธาตุหลัก ที่ทำงานร่วมกัน:
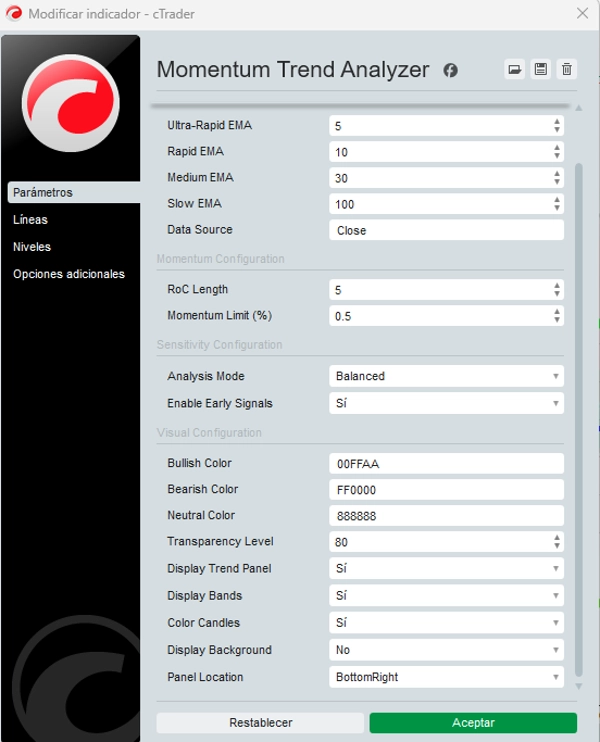
- ค่าเฉลี่ยเคลื่อนที่เลขชี้กำลัง (EMA) 📈
-
- ใช้ EMA สี่ตัว ที่มีช่วงเวลาต่างกัน: เร็วมาก, เร็ว, กลาง, และช้า—โดยปกติคำนวณจากราคาปิด
- EMA ระยะสั้น (เร็วมาก & เร็ว) ตรวจจับ การเคลื่อนไหวทันที ขณะที่ EMA ระยะยาว (กลาง & ช้า) สะท้อน แนวโน้มที่ยั่งยืน.
- อัตราการเปลี่ยนแปลง (RoC) ⚡
-
- วัด เปอร์เซ็นต์การเปลี่ยนแปลงราคา ในช่วงเวลาที่กำหนด ทำหน้าที่เป็นตัวชี้วัดโมเมนตัมโดยตรง
- RoC แบบเรียบเนียน ช่วยกรองความผันผวนเล็กน้อยและทำให้สัญญาณมั่นคงขึ้น.
- ช่วงจริงเฉลี่ยปกติ (ATR) 🌪️
-
- ATR วัด ความผันผวนในอดีต โดยทำการปรับให้เป็นสัดส่วนด้วยการหารด้วยราคาปัจจุบันเพื่อการประเมินสัมพัทธ์
- ATR ปกติที่สูง บ่งชี้ความผันผวนที่เพิ่มขึ้น ส่งผลต่อการตีความความแข็งแกร่งของแนวโน้ม
- ดัชนีความแข็งแกร่งสัมพัทธ์ (RSI) 💪
-
- ออสซิลเลเตอร์นี้วัด ขนาดและความเร็ว ของการเคลื่อนไหวราคา ระบุสภาวะ ซื้อมากเกินไป/ขายมากเกินไป.
- ช่วยประเมิน ความเข้มข้นของโมเมนตัม ภายในแนวโน้ม
- ปริมาณเฉลี่ย 🔊
-
- ค่าเฉลี่ยเคลื่อนที่ง่ายของปริมาณการซื้อขายตรวจจับ ช่วงเวลาที่มีกิจกรรมสูง เสริมความถูกต้องของสัญญาณ
ตรรกะการคำนวณ 🧠
เครื่องวิเคราะห์แนวโน้มโมเมนตัม สร้างสัญญาณแนวโน้มและความแข็งแกร่ง ผ่านการรวมกันของเงื่อนไขและการคำนวณเฉพาะ:
1. การกำหนดแนวโน้ม
- 🟢 แนวโน้มขาขึ้น: ยืนยันเมื่อ EMA เร็ว > EMA กลาง, EMA กลาง > EMA ช้า และราคาปิด > EMA เร็ว
- 🔴 แนวโน้มขาลง: ยืนยันเมื่อ EMA เร็ว < EMA กลาง, EMA กลาง < EMA ช้า และราคาปิด < EMA เร็ว
- ⚪ แนวโน้มเป็นกลาง: เกิดขึ้นเมื่อไม่มีเงื่อนไขใดเป็นจริง บ่งชี้ถึง การรวมตัวหรือความไม่แน่นอน.
2. สัญญาณแนวโน้มเบื้องต้น 🔍
- ตรวจจับ การเปลี่ยนแปลงแนวโน้มที่อาจเกิดขึ้น ก่อนการยืนยันเต็มรูปแบบโดยใช้:
-
- EMA เร็วมาก
- ความชันของ EMA เร็ว
- RoC แบบเรียบเนียน
- ตัวอย่าง: สัญญาณขาขึ้นเบื้องต้นจะถูกกระตุ้นหาก EMA เร็วมากตัดขึ้นเหนือ EMA เร็ว, ความชันของ EMA เร็วเป็นบวก และ RoC แบบเรียบเนียนเกินเกณฑ์โมเมนตัม
3. การปรับความไว ⚖️
มีสามโหมดให้เลือก:
- 🛡️ ระมัดระวัง: ให้ความสำคัญกับสัญญาณที่ยืนยันแล้ว ลดสัญญาณผิดพลาด (ตรวจจับช้า)
- ⚔️ รุกแรง: เน้นสัญญาณเบื้องต้นเพื่อตอบสนองเร็วขึ้น (ความเสี่ยงสูงขึ้น)
- ⚖️ สมดุล: แนวทางกลาง
4. การคำนวณความแข็งแกร่งของแนวโน้ม 💯
ความแข็งแกร่งได้มาจาก การรวมถ่วงน้ำหนัก ของ:
- การกระจาย EMA: ระยะห่าง (%) ระหว่าง EMA เร็วและช้า
- ส่วนร่วมของ RSI: ความแตกต่างระหว่าง RSI กับ 50 (ขาขึ้น/ขาลง)
- ความผันผวน (ATR ปกติ): ปรับความแข็งแกร่งตามความผันผวนของตลาด
- ปริมาณสัมพัทธ์: ความแข็งแกร่งเพิ่มขึ้นถ้าปริมาณปัจจุบัน > ค่าเฉลี่ย
- โมเมนตัม (RoC แบบเรียบเนียน): วัดความเร็วการเคลื่อนไหว
- ผลลัพธ์: เป็น เปอร์เซ็นต์ความแข็งแกร่ง (0%-100%)—ค่ายิ่งสูง = แนวโน้มที่แข็งแกร่ง
5. แถบไดนามิก 🎯
- แถบบน/ล่างสามแถบอิงจากราคาสูง/ต่ำล่าสุด
- ทำหน้าที่เป็น แนวรับ/แนวต้านไดนามิก ปรับตามความผันผวนของตลาด
การใช้งานจริงสำหรับเทรดเดอร์ 💼
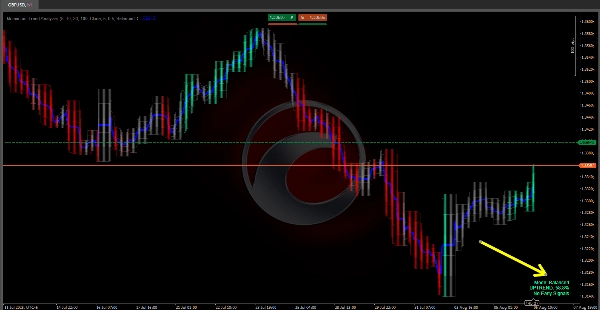
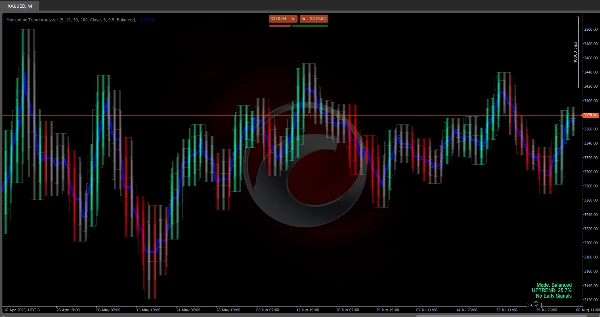
- 📊 การแสดงผล: แสดงแนวโน้มผ่านการไล่ระดับสี (🟢 ขาขึ้น, 🔴 ขาลง, ⚪ เป็นกลาง) + เส้นแนวโน้ม
- 💪 ความแข็งแกร่ง: ค่าเปอร์เซ็นต์ (เช่น 24.3% = ระวัง; >50% = ความมั่นใจสูง)
- 🔄 กลยุทธ์แถบ:
-
- ขาขึ้น: ซื้อที่แถบล่าง, ขายที่แถบบน
- ขาลง: ขายที่แถบบน, ปิดที่แถบล่าง
- 🚨 สัญญาณเบื้องต้น: ช่วยเทรดเดอร์ที่รุกแรงคาดการณ์ตลาดที่เคลื่อนไหวรวดเร็ว
- 🛠️ ความยืดหยุ่น: โหมดความไวปรับให้เหมาะกับ ระมัดระวัง (รอยืนยัน) หรือ รุกแรง (ลงมือก่อน) สไตล์
บทสรุป 🎯
เครื่องวิเคราะห์แนวโน้มโมเมนตัม ให้การวิเคราะห์แนวโน้มและโมเมนตัมอย่างครบถ้วน โดยผสานรวม EMAs, RoC, ATR ปกติ, RSI และปริมาณ ตรรกะการคำนวณของมัน—อิงตามเงื่อนไขชัดเจนและปัจจัยถ่วงน้ำหนัก—ปรับให้เข้ากับ ระดับความเสี่ยงและกลยุทธ์การเทรดที่แตกต่างกัน ทำให้เป็นเครื่องมือที่ทรงพลังสำหรับเทรดเดอร์
สรุป
The indicator determines bullish, bearish, or neutral trends based on EMA relationships and price positioning. It provides early trend shift signals using ultra-fast EMA, fast EMA slope, and smoothed RoC. Users can select from three sensitivity modes—conservative, balanced, and aggressive—to adjust signal responsiveness according to their trading style.
Trend strength is calculated as a weighted integration of EMA spread, RSI deviation from neutral, normalized volatility, relative volume, and momentum, expressed as a percentage from 0% to 100%. The indicator also features dynamic bands derived from recent price highs and lows, serving as adaptive support and resistance levels.
Visualization includes colored shading to indicate trend direction and a trendline, with strength values aiding decision-making. The band strategy suggests buying near lower bands and selling near upper bands in bullish trends, and the reverse in bearish trends. This tool supports diverse risk levels and trading strategies by providing comprehensive trend and momentum analysis.


!["[Stellar Strategies] Market Structure Breakout" โลโก้](https://cdn.ctrader.com/image/webp/bceec265-3247-4b11-915f-6295a29c106d_28465)

