
SMCTimingIndicator
Wskaźnik
143 pobrania
Wersja 1.0, Dec 2025
Windows, Mac
Opis
📜 Opis
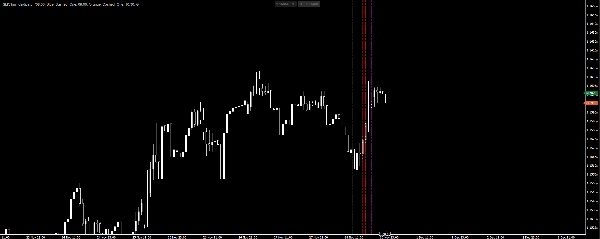
SMC Timing Indicator to konfigurowalne narzędzie dla platformy cTrader, które pomaga traderom wizualizować intraday timing oraz strukturę sesji rynkowej. Zostało zaprojektowane zwłaszcza dla tych, którzy stosują Smart Money Concepts (SMC) oraz strategie ICT, gdzie precyzyjny timing jest kluczowy.
✨ Kluczowe funkcje
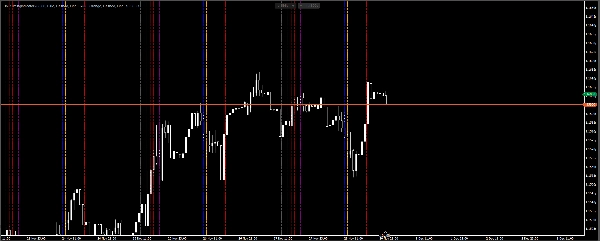
- Do 8 konfigurowalnych linii pionowych na dzień
- Pełna personalizacja czasu, koloru, stylu i grubości dla każdej linii
- Opcja wyświetlania historycznych linii z poprzednich dni handlowych
- Parametr przesunięcia UTC dla elastycznego dopasowania strefy czasowej
- Czysta, modułowa architektura wykorzystująca enumy, pomocniki i serwisy
- Open‑source i darmowe do użytku i udostępniania
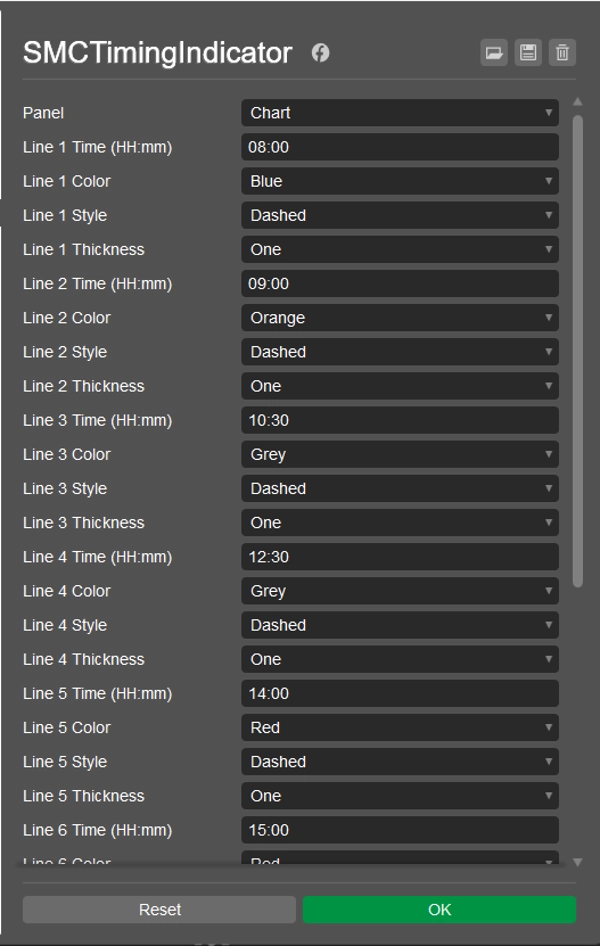
⚙️ Parametry
Każda linia ma własny zestaw parametrów (czas, kolor, styl, grubość), co pozwala dostosować wskaźnik do Twoich potrzeb handlowych.
📈 Użytkowanie
- Zainstaluj wskaźnik w cTrader Automate.
- Skonfiguruj czasy i style dla swoich linii.
- Dopasuj przesunięcie UTC, aby odpowiadało Twojej lokalnej strefie czasowej lub czasowi serwera brokera.
- Włącz Pokaż historyczne linie, aby wizualizować czasy sesji z przeszłości.
📦 Licencja
Opublikowano na podstawie Licencji MIT – darmowe do używania, modyfikowania i dystrybucji.
Podsumowanie
Podsumowanie AI
SMC Timing Indicator is a customizable indicator for the cTrader platform designed to mark trading sessions with vertical lines. It supports up to eight configurable vertical lines per day, each with adjustable time, color, style, and thickness settings. The indicator includes a UTC offset parameter to align session times with different time zones or broker server times. Users can enable the display of historical session lines to visualize past trading days. The tool is particularly suited for traders using Smart Money Concepts (SMC) and ICT strategies, where precise intraday timing and market session structure visualization are important. It features a modular architecture and is published under the MIT License, allowing free use, modification, and distribution. Installation and configuration are done through cTrader Automate.
Profil wskaźnika
Opinie klientów
0.0
Opinie: 0
Opinie klientów
Ten produkt nie ma jeszcze opinii. Wypróbowałeś(-aś) go już? Bądź pierwszy(-a) i powiedz o tym innym!
Dyskusja
Częste pytania
Forex
EURUSD
SMC
Produkty dostępne za pośrednictwem cTrader Store, w tym boty handlowe, wskaźniki i wtyczki, dostarczane są przez deweloperów zewnętrznych i udostępniane wyłącznie w celach informacyjnych oraz w celu zapewnienia dostępu technicznego. cTrader Store nie jest brokerem i nie zapewnia doradztwa inwestycyjnego, nie udziela spersonalizowanych rekomendacji ani nie gwarantuje przyszłych wyników.
Więcej od tego autora


Cena
Od 24/09/2025
370
Bezpłatne instalacje