Opis
🚀 Przekształć swoje handlowanie Renko dzięki precyzyjnej wizualizacji knotów
Odkryj ukryte dane rynkowe, których standardowe wykresy Renko Ci nie pokazują! 📈
✨ Co sprawia, że ten wskaźnik jest wyjątkowy?
🎯 Prawdziwa analiza na poziomie ticków - W przeciwieństwie do innych wskaźników, które zgadują, to narzędzie analizuje każdy pojedynczy tick w obrębie każdego klocka Renko, aby ujawnić rzeczywiste ekstremalne wartości cen, które wystąpiły podczas formowania.
🔍 Zobacz to, co inni przeoczają - Odkryj prawdziwe maksima i minima, które miały miejsce w każdym klocku Renko, dając Ci kluczowe informacje rynkowe dla lepszych decyzji wejścia i wyjścia.
💪 Kluczowe cechy, które wyróżniają ten wskaźnik:
🏗️ Inteligentna technologia lokalnego przechowywania
- Automatycznie zapisuje wszystkie obliczone knoty w lokalnej pamięci
- Nigdy nie tracisz swoich danych - nawet podczas zmiany wykresów, interwałów czasowych lub restartu cTrader
- Inteligentne ładowanie przyrostowe zapobiega ponownemu obliczaniu istniejących danych
- Minimalny wpływ na wydajność podczas restartu platformy
⚡ Błyskawiczna wydajność
- Stopniowe ładowanie dzień po dniu z wyświetlaniem postępu w czasie rzeczywistym
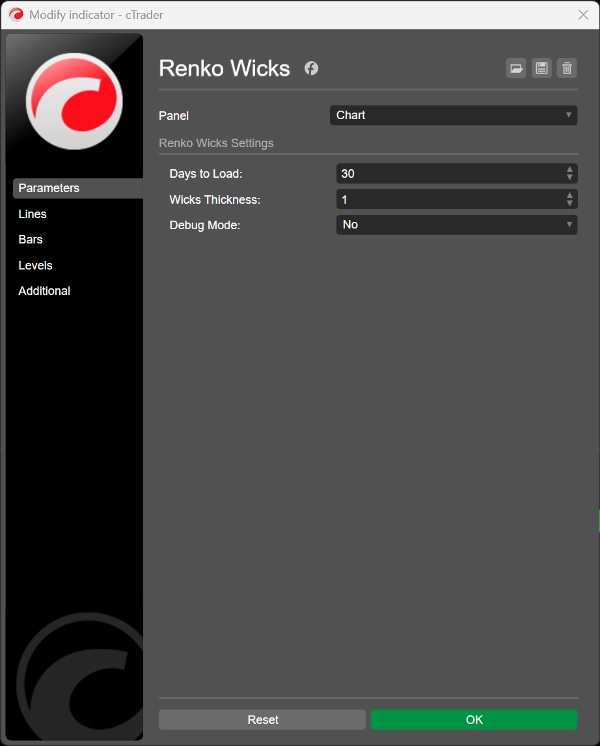
- Konfigurowalna głębokość historii (1+ dni)
- Optymalizowane wykorzystanie pamięci dla płynnej pracy wykresu
🎨 Profesjonalny design wizualny
- Automatycznie dopasowuje się do schematu kolorów byków/niedźwiedzi na Twoim wykresie
- Regulowana grubość knota (1-5 pikseli) dla idealnej widoczności
- Czysty, nieinwazyjny wyświetlacz, który wzmacnia Twoją analizę
🛡️ Niezawodność jak skała
- 100% trwałość danych - Twoje knoty przetrwają restarty platformy, zmiany wykresów i interwałów czasowych
- Inteligentne zapobieganie duplikatom zapewnia czystość wykresów
- Wbudowane obsługiwanie błędów dla maksymalnej stabilności
- Tryb debugowania dla przejrzystości i rozwiązywania problemów
🎯 Idealny dla:
📊 Day Traderów - Wykrywaj ekstremalne wartości intraday dla precyzyjnych okazji skalpowania
📈 Swing Traderów - Identyfikuj kluczowe poziomy wsparcia/oporu w klockach Renko
🔄 Analizę wielointerwałową - Każdy interwał czasowy utrzymuje własną bazę danych knotów
🚨 Dlaczego knoty Renko są ważne:
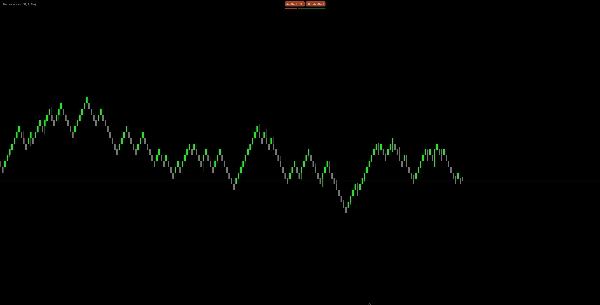
Standardowe wykresy Renko pokazują tylko otwarcie i zamknięcie każdego klocka, ale ogromne ruchy cen zdarzają się pomiędzy nimi! Ten wskaźnik ujawnia:
- 📉 Prawdziwe poziomy wsparcia/oporu, gdzie cena faktycznie dotknęła
- 🎪 Wgląd w zmienność rynku w trakcie formowania każdego klocka
- 🎯 Lepsze punkty wejścia/wyjścia oparte na rzeczywistych ekstremach cen
- 📊 Ulepszona analiza struktury rynku dla świadomych decyzji
Stworzone przez prawdziwego tradera Renko ♥
Podsumowanie
Key features include smart local storage that preserves calculated wick data across chart switches, timeframes, and platform restarts, ensuring data persistence and minimizing recalculations. The indicator offers fast, progressive day-by-day data loading with configurable history depth and optimized memory usage for smooth performance. Visually, it adapts to the chart’s bull/bear color scheme and allows adjustable wick thickness for clear, non-intrusive display.
Renko Wicks Pro supports multiple timeframes, maintaining separate wick databases for each, making it suitable for day traders seeking precise scalping points and swing traders identifying key levels. It includes built-in error handling, duplicate prevention, and a debug mode for stability and troubleshooting.
By revealing hidden price movements within Renko bricks, this indicator aids in identifying true market structure, improving entry and exit decisions based on actual price extremes.