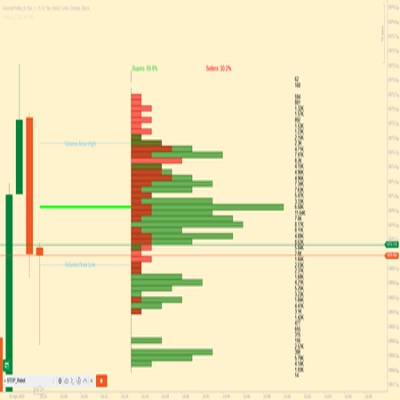
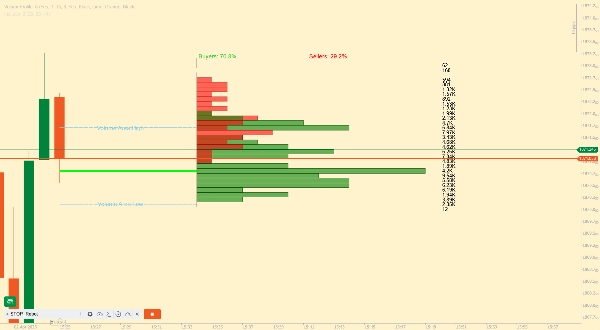
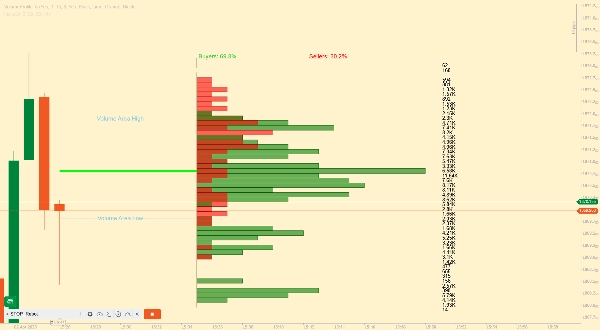
VolumeProfile_8
Logo „VolumeProfile_8”
5.0
03/09/2025
763
Desktop
Since 09/01/2025
Free installs
5672
Przesłany obraz „VolumeProfile_8”Przesłany obraz „VolumeProfile_8”

Hi. This volume profile is especially made for Scalpers. The indicator loads very fast as it don`t use historical data. It uses Pure MarketDepth data Market Orders including Limit orders. So you will see both. You can customize the indicator fully, there is many parameters you can use to adjust it to your liking. Also It contains a warning system to show you potential Absorbtion so you will be aware of this. It is made for light Theme. On dark theme you will not be able to see the Volumes. I was too lazy to make it for both themes. :-( . This indicator is free and without Source Code. If you are interested, you can Buy the source code. Have Phun . Also if you want the profile to reset every bar or every 100 bars , you can. Look at the parameters,

5.0
Opinie: 1
5
100 %
4
0 %
3
0 %
2
0 %
1
0 %
Opinie klientów
August 12, 2025
Pros: Accurate volume distribution with Point of Control and Value Area levels. Flexible settings and multiple profile types. Useful for trend and support/resistance analysis. Cons: No alerts or tooltips. No history or template saving. Can be heavy on low-end PCs with multiple profiles.
Więcej od tego autora
Cumulative Delta Candles + VolumeProfile
Cumulative delta candles + volume profile
Support Resistance Zones
Support and Resistance.
DynamicVolumeSupplyDemand
Supply and Demand Zones
Insider_CumulativeDelta
Robust Cumulative delta,Atr and imbalance indicator.
Tape reader
TAPE READER :-)
Wskaźnik
Grid
NAS100
NZDUSD
+17
Institutional Volume Supply Demand
Volume Profile Supply Demand
Wskaźnik
Breakout
BreakOut_Probability_Expo
Break Out Probability Experimental indicator. Credits for this indicator goes to Zeiierman !!!
Wskaźnik
NAS100
NZDUSD
XAUUSD
+13
ORDERFLOW_SKIA_Plynuly
This Indicator will show you Direction, Distance, and Time;
MTF Candles
Multi Timeframe Candle drawing. Draw Any candles from any timeframe on your chart :-)
Cumulative Delta_noSourceCode
Demo of my main indcator.
Możesz także polubić
Wskaźnik
Indices
XAUUSD
Commodities
+5
cAlgoBuddy - Chaos Reversals
The cTrader Chaos Reversals indicator brings high-quality reversal signals to traders.
Wskaźnik
Indices
RSI
StochasticRSI
Stochastic RSI (StochRSI) is a technical indicator used to measure the strength and weakness of the RSI.
Zig zag v.1 Demo
ZigZag Pro DEMO – Multi-Swing Indicator for cTrader DEMO VERSION – 24 hours free trial! This is a DEMO version of the Z
Wskaźnik
Breakout
Signal
Bollinger
[Hamster-Coder] Bollinger Bands
Bolliger Bands + Hamster-Coder™ Timeframe Decoupling
Wskaźnik
Grid
RSI
Breakout
+18
Logarithmic Framework by LudwigICT
Zero Lag Exponential Moving Average
ZLEMA (Zero Lag EMA) is a faster, smoother version of EMA, ideal for capturing quick market shifts and trends.
Candle Timer & Strength Demo
Candle Timer & Strength DEMO for cTrader This is a DEMO version of the Candle Timer & Strength indicator. You can use al
Wskaźnik
Grid
NAS100
NZDUSD
+18
Zig Zag ATR
ZigZag Pro — Advanced swing detection with ATR threshold, fractal confirmation, and colored segments. Clean market
Wskaźnik
RSI
Breakout
XAUUSD
+5
Trailing Smart Algorithm
Trailing algo 📈 auto-tracks trends 🎯 adapts to volatility 🌟 precise moves 🛡️ retest signals 🚀 no lag, smart market
Wskaźnik
NAS100
NZDUSD
XAUUSD
+8
Squeeze Breakout Regression System
💥Detects moments when the market is "compressed" and about to explode in any direction 💥
Wskaźnik
NAS100
NZDUSD
XAUUSD
+10
Atlas Seasonal Returns Heatmap
🧭 See when your market tends to move—by Month, Day-of-Week, or Hour-of-Day🧭
Previous Day Liquidity Zones (PDH - PDL)
Useful indicator for traders who want to visualize key price levels based on previous daily highs and lows.
Fury Team E_M_A_su_TF
EMA ON TF (MULTI-TIMEFRAME)
Trend Direction Force Index - TDFI (Alerts)
Spot Strong Trends Early & Filter Market Noise
Wskaźnik
Indices
RSI
Stocks
+5
REDGREENZONEREVERSAL
The Red & Green Zone Reversal Indicator detects overbought and oversold market conditions using Bollinger Bands and RSI.
Wskaźnik
RSI
Breakout
Supertrend
Market Trend OB
Price action to detect when the market changes trend (MSB) and defines, order blocks , ZigZag etc.📊
Wskaźnik
NAS100
NZDUSD
Martingale
+26
MultiMA-display
This indicator is a powerful visualization tool 💡. Its design is flexible, robust, and solves a core problem for multi-
SmartLiquidityZonesPRO
Smart Liquidity Zones PRO auto-detects liquidity grabs, wicks, traps & manipulations — trade like the smart money.