
Descrizione
NOVITÀ! ❇️ Puoi anche provare "Universal Assistant Toolkit - UATKit" come indicatore; che, oltre alla funzione Dynamic Candle Timer, offre contemporaneamente altre sei funzionalità molto utili. Sono sicuro che sarai felice di averle tutte insieme.
📢 La versione precedente (versione 1.5) è scaduta dal primo giorno del 2026;
v2.2 è una versione stabile con correzioni di bug e senza data di scadenza. Puoi scaricarla/aggiornarla e installarla dalla scheda "Version History".
Panoramica:
Questo è uno strumento indispensabile per i trader che si affidano al timing delle candele. Che tu sia uno scalper, un day trader o un swing trader, questo indicatore ti assicura di sapere sempre quanto tempo rimane — o è passato — sulla barra corrente.
Perché usare questo indicatore?
- Operare con precisione: Sapere esattamente quando la candela corrente si chiuderà.
- Modalità timer flessibili: Traccia il tempo in diversi modi per adattarti al tuo stile di trading.
- Notifiche audio: Ricevi avvisi quando la candela sta per terminare o raggiunge un certo punto.
- Posizionamento personalizzabile: Fissa il timer ovunque sul grafico o attaccalo all'ultima candela.
- Prestazioni ottimizzate: Leggero ed efficiente per un'esecuzione fluida.
- Tipi di grafico multipli: Funziona su grafici basati sul tempo, Heikin Ashi e Tick.
Caratteristiche principali:
✅ Modalità timer multiple: Scegli come tracciare il progresso della candela:
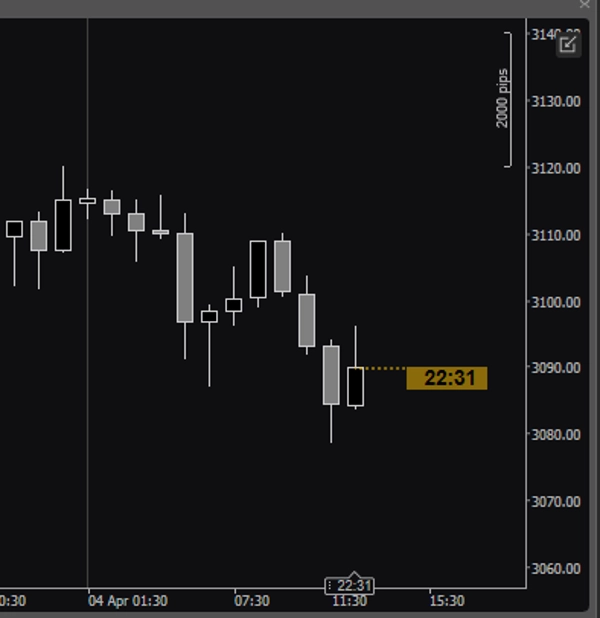
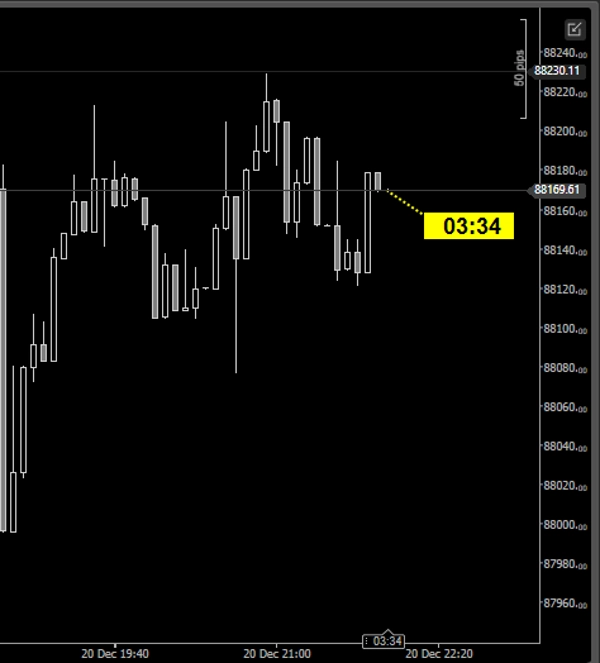
- Tempo rimanente/trascorso (HH:MM:SS)
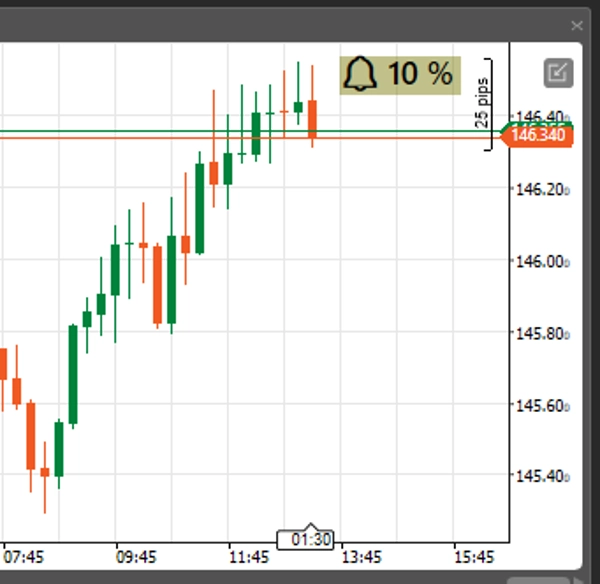
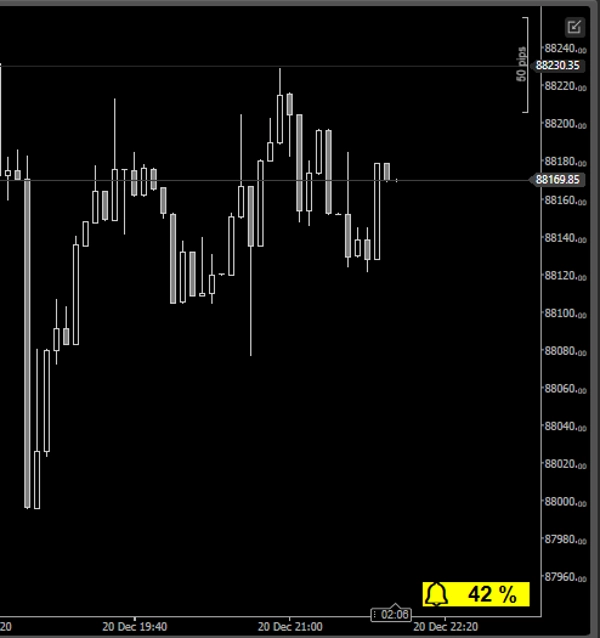
- Percentuale rimanente/trascorsa
- Secondi rimanenti/trascorsi
✅ Posizionamento dinamico o fisso:
- Modalità fissa: Imposta il timer in una posizione specifica del grafico.
- Modalità dinamica: Attacca il timer al prezzo di chiusura dell'ultima candela.
✅ Avvisi di notifica:
- Imposta un avviso audio per notificarti quando rimane una certa quantità di tempo prima della chiusura della candela.
✅ Aspetto personalizzabile:
- Regola dimensione del font, colore, sfondo e posizione per adattarlo al tuo stile di grafico.
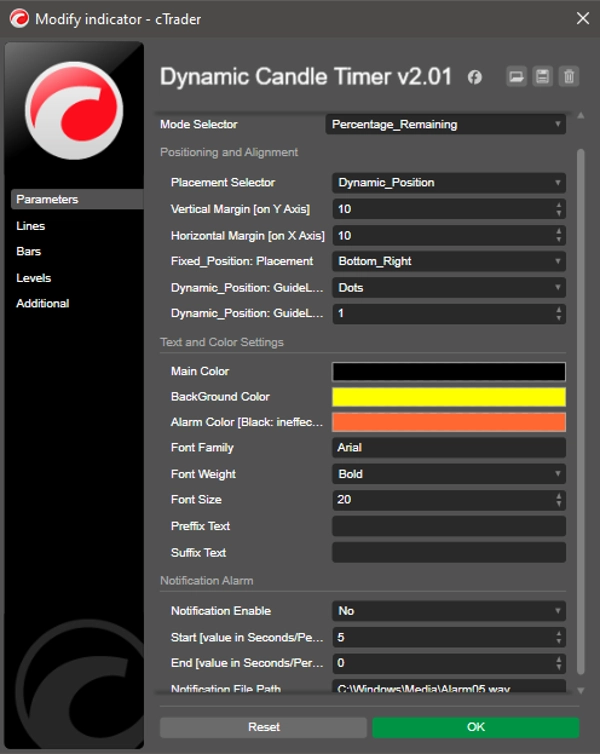
Impostazioni e parametri personalizzabili:
🛠 Tipo di timer: Scegli tra 6 diverse modalità di tracciamento.
📍 Posizionamento: Seleziona posizionamento fisso o attacca alla chiusura dell'ultima candela.
🔊 Impostazioni avviso: Imposta una finestra temporale personalizzata per le notifiche sonore.
🎨 Opzioni di aspetto: Personalizza font, colori e sfondo.
Non perdere mai più la chiusura di una candela — usa Dynamic Candle Timer!
Riepilogo
Key functionalities include multiple timer modes such as time remaining or passed (in HH:MM:SS), percentage remaining or passed, and seconds remaining or passed. The timer can be positioned either fixed at a specific chart location or dynamically attached to the latest candle’s closing price. Users can set audio alerts to notify when a candle is nearing its close or reaches a specified time point.
The indicator supports multiple chart types including Time-Based, Heikin Ashi, and Tick charts. Appearance customization options allow adjustment of font size, color, background, and placement to fit individual chart styles. Performance is optimized for smooth execution with a lightweight design.
Customizable settings include six different timer tracking modes, positioning choices, alert timing windows, and appearance parameters. This tool helps traders maintain awareness of candle timing to enhance trade precision.
Recensioni dei clienti
5 | 100 % | |
4 | 0 % | |
3 | 0 % | |
2 | 0 % | |
1 | 0 % |


![Logo di "[Stellar Strategies] BOS Trend 1.0"](https://cdn.ctrader.com/image/webp/6cdec0f1-0e97-4a82-a8a4-2b67aed54d38_25695)


