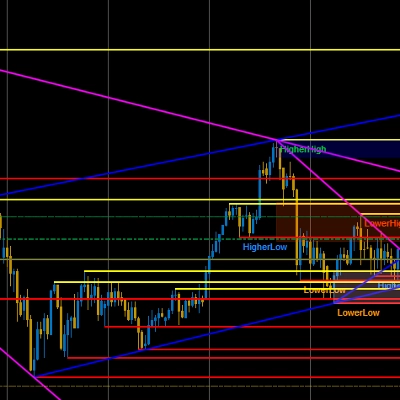
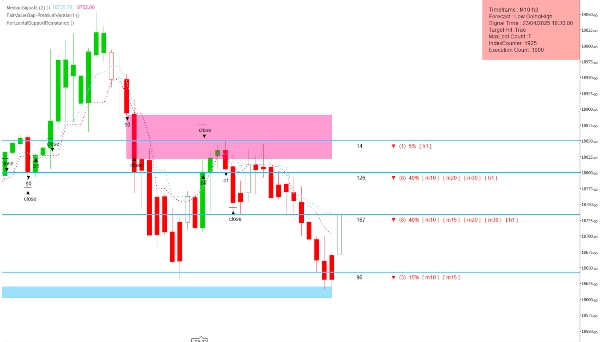
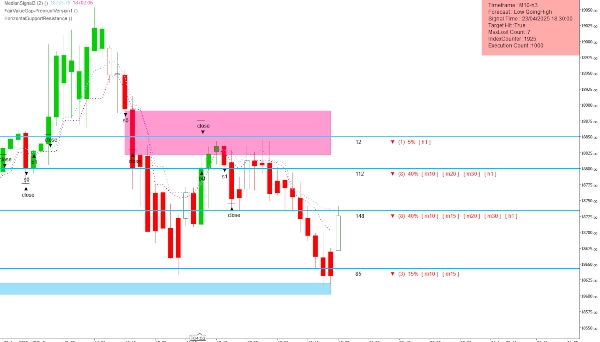
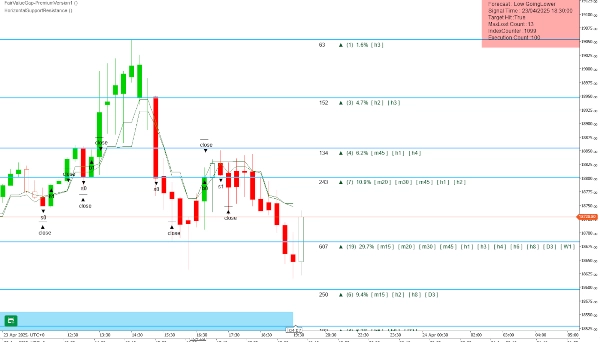
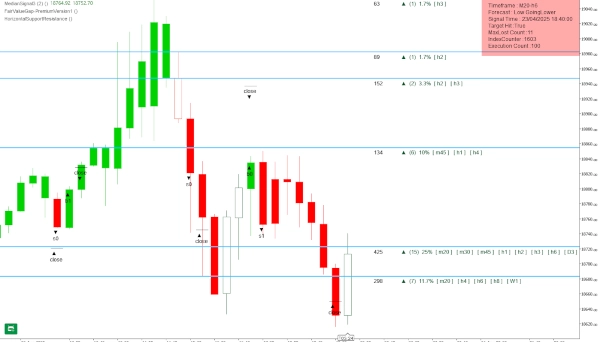
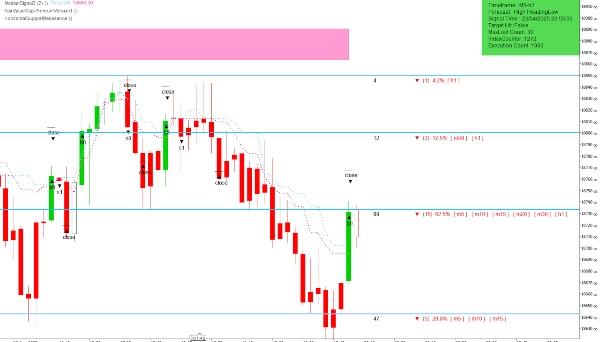
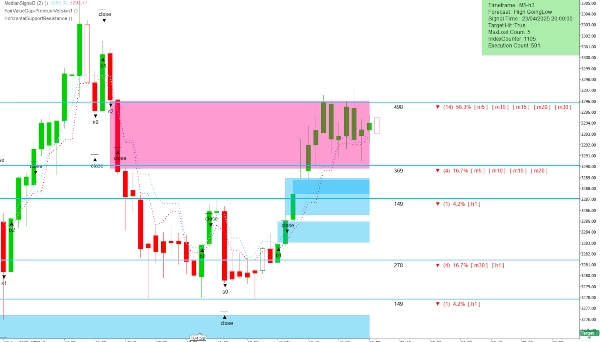
Indicatore
Indices
Stocks
Forex
GBPUSD
Scalping
HorizontalSupportResistance
Logo di "HorizontalSupportResistance"
4.5
03/09/2025
308
Desktop
Immagine caricata di "HorizontalSupportResistance"Immagine caricata di "HorizontalSupportResistance"Immagine caricata di "HorizontalSupportResistance"Immagine caricata di "HorizontalSupportResistance"Immagine caricata di "HorizontalSupportResistance"Immagine caricata di "HorizontalSupportResistance"

This extraordinary multi timeframe support and resistance indicator is nothing short of market wizardry. Designed with precision and backed by smart logic, it identifies critical price levels on all forex, indices, or stocks but especially on the NASDAQ100 with uncanny accuracy. Like a seasoned trader’s intuition encoded into a visual tool, it highlights key zones where price reacts, reverses, or accelerates—giving you an edge that feels almost supernatural. With clean candlestick representation and vibrant, clearly marked levels, this indicator doesn’t just follow the market—it anticipates it. Whether you're scalping short-term moves or holding longer-term positions, this tool acts like your personal trading oracle, quietly guiding you to smarter, more confident decisions.

Altro da questo autore
Più votato
Gratis
FairValueGap
This Fair Value Gap (FVG) indicator is a technical analysis tool used to identify potential price imbalances.
FairValueGap-PremiumVersion1
This Fair Value Gap (FVG) indicator is a technical analysis on multi-timeframe.
Più votato
Gratis
BarSentiments
This Indicator is a technical analysis tool that measures the strength and direction of market sentiment
Potrebbe interessarti anche
Zero Lag Exponential Moving Average
ZLEMA (Zero Lag EMA) is a faster, smoother version of EMA, ideal for capturing quick market shifts and trends.
MA Sabres
Conquer the markets with MA Sabres! This indicator spots trend flips with MAs and cool Sabre shapes & alerts.
Indicatore
RSI
Breakout
Supertrend
+3
Fibonacci Linear Regression Multi-timeframe
Combining Fibonacci levels and regression to analyze multidimensional market trends across multiple timeframes¡
Cumulative Delta_noSourceCode
Demo of my main indcator.
Precio Promedio Ponderado por Volumen
VWAP (Volume Weighted Average Price, Precio Promedio Ponderado por Volumen)
Indicatore
Signal
MACD
MacD Custom Indicator Multi Time Frame
MacD Custom Indicator-Multiple Time Frame+All Available Options!
Golden Boom And Crash Spike Detector
Golden Boom and Crash Spike Detector is a trading tool designed for Crash 300 and Boom 300 indices on M1 Timeframe.
Indicatore
NAS100
Indices
XAUUSD
+4
PrevDayProjection
Automatically calculates the previous day’s high and low, determines the range, and then projects Fibonacci levels.
Market Entropy
Market entropy + DC. Spot crystallization/chaos shifts with an optional on-chart overlay.
CandleCounterAlex
CandleCounterAlex – Candle Cycle Counter with Colors and Adjustable Position.
Indicatore
NAS100
Indices
Breakout
+6
cAlgoBuddy - Boxify
The purpose of the algorithm of the Boxify indicator is to try to put price action into zones, or better, boxes.
IR Multi Data
show symbol and time fram, daily net profit percent, daily net profit, and spread ln your chart. consider that timezone
SmartFibonacci
SmartFibonacci — automatic Fibonacci retracements & extensions with swing detection, alerts and clean labels for cTrader
Indicatore
Signal
Scalping
Major Tops and Bottoms
Average accuracy of around 60% to 70% on 45min timeframes it is highly recommended to use stop losses
Indicatore
NAS100
RSI
NZDUSD
+18
HAIQuantum-V10
The HAI Quantum V10 is an advanced indicator designed for technical analysis
Indicatore
NAS100
NZDUSD
XAUUSD
+10
Atlas Seasonal Returns Heatmap
🧭 See when your market tends to move—by Month, Day-of-Week, or Hour-of-Day🧭
VWAP
Track VWAP for Asia, London, NY, Sydney, Daily, Weekly, Monthly & Custom Sessions. Perfect for FX & intraday trading!