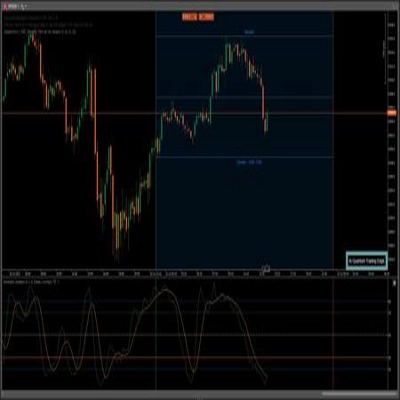
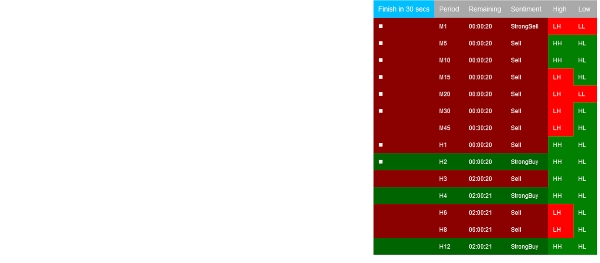
ตัวบ่งชี้แผนภูมิความรู้สึกแท่งนี้เป็นเครื่องมือวิเคราะห์ทางเทคนิคที่วัดความแข็งแกร่งและทิศทางของความรู้สึกตลาดในแต่ละแท่ง (หรือแต่ละแท่งเทียน) โดยจะตรวจสอบความสัมพันธ์ระหว่างราคาที่เปิด สูง ต่ำ และปิดของแต่ละแท่งเพื่อกำหนดว่าตลาดแสดงพฤติกรรมกระทิง หมี หรือเป็นกลางในช่วงเวลานั้น
โดยทั่วไป ความรู้สึกกระทิง จะถูกระบุเมื่อราคาปิดสูงกว่าราคาเปิดอย่างมีนัยสำคัญ ซึ่งบ่งชี้แรงกดดันในการซื้อที่แข็งแกร่ง ความรู้สึกหมี จะถูกตรวจพบเมื่อราคาปิดต่ำกว่าราคาเปิดอย่างชัดเจน ซึ่งบ่งชี้แรงกดดันในการขายที่แข็งแกร่ง แท่งที่เป็นกลาง ซึ่งมักเรียกว่า "โดจิ" แสดงถึงความไม่แน่ใจหรือความสมดุลระหว่างผู้ซื้อและผู้ขาย
เวอร์ชันขั้นสูงของตัวบ่งชี้ความรู้สึกแท่งอาจรวมองค์ประกอบเพิ่มเติม เช่น ปริมาณ ขนาดตัวแท่งสัมพัทธ์ หรือโมเมนตัม เพื่อปรับปรุงการจำแนกความรู้สึก ความรู้สึกมักจะแสดงผ่านการใช้สี—สีเขียวสำหรับกระทิง สีแดงสำหรับหมี และสีเทาหรือสีน้ำเงินสำหรับเป็นกลาง—ทำให้ง่ายต่อการประเมินโทนตลาดที่มีอยู่ได้อย่างรวดเร็ว
ถ้า 1s และ 0s เป็นบล็อกพื้นฐานของวิศวกรรมซอฟต์แวร์ ผลลัพธ์ของตัวบ่งชี้แผนภูมิความรู้สึกแท่งจะแทนบล็อกพื้นฐานของระบบการซื้อขายด้วยการเรียนรู้ของเครื่องขั้นสูง โดยการวัดความรู้สึกตลาดดิบ มันจะให้ข้อมูลป้อนเข้าที่จำเป็นสำหรับอัลกอริทึมที่พยายามเรียนรู้และทำนายการเคลื่อนไหวของราคาในอนาคตตามพฤติกรรมในอดีต
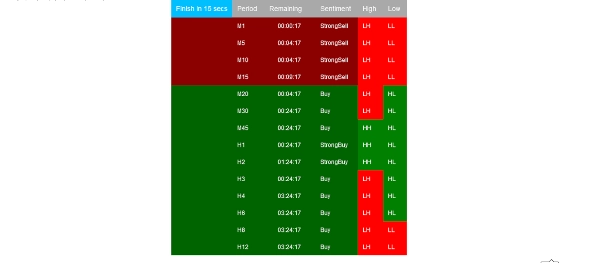
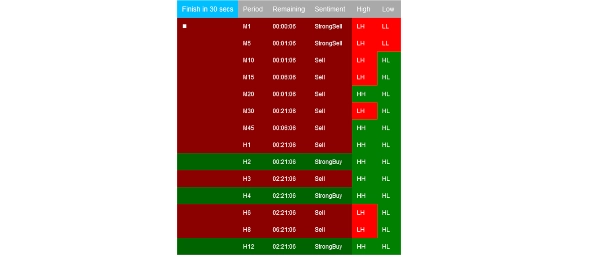
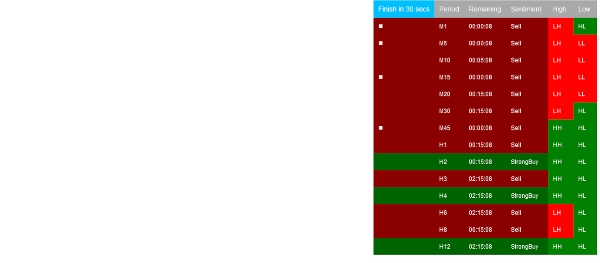
การใช้ตัวบ่งชี้แผนภูมิความรู้สึกแท่งช่วยให้ผู้ซื้อขายเข้าใจพลวัตของตลาดขนาดเล็กได้ลึกซึ้งยิ่งขึ้น ช่วยให้พวกเขาระบุความแข็งแกร่งของแนวโน้ม การกลับตัวที่เป็นไปได้ และช่วงการรวมตัว—โดยเฉพาะอย่างยิ่งเมื่อรวมกับการวิเคราะห์หลายกรอบเวลาและเครื่องมือทางเทคนิคอื่นๆ
5 | 100 % | |
4 | 0 % | |
3 | 0 % | |
2 | 0 % | |
1 | 0 % |