
True Trend H4
Indicatore
2 acquisti
Versione 1.0, Jun 2025
Windows, Mac
4.0
Recensioni: 1
Descrizione
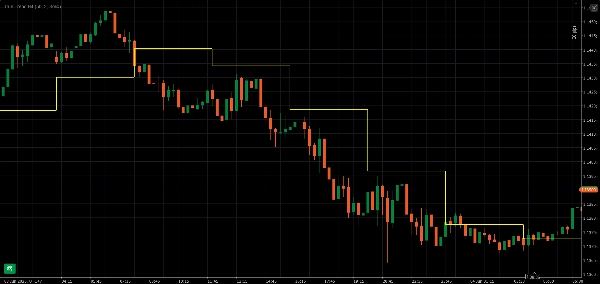
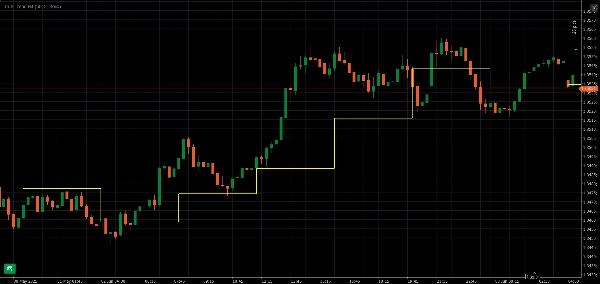
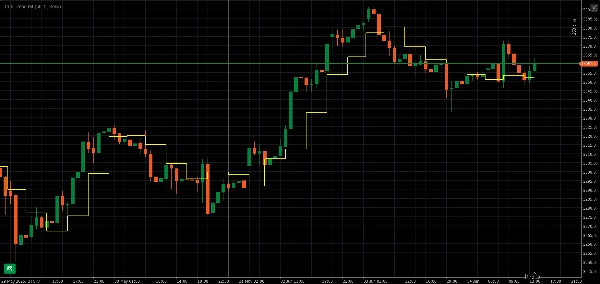
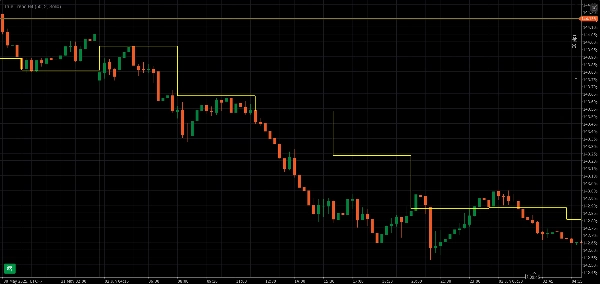
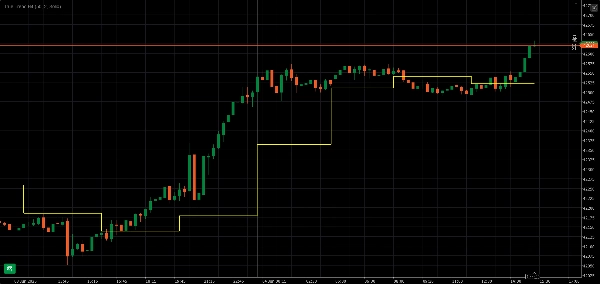
L'indicatore True Trend H4 utilizza una linea a gradini per fornire una chiara indicazione della direzione del trend H4. Puoi vederlo molto bene su timeframe più piccoli come M1, M5, M15, M30 e H1.
Riepilogo
Profilo indicatore
Recensioni dei clienti
4.0
Recensioni: 1
5 | 0 % | |
4 | 100 % | |
3 | 0 % | |
2 | 0 % | |
1 | 0 % |
Recensioni dei clienti
June 7, 2025
The signal still needs a chart check, no surprise there. A 5 minute check should not become a 30 minute rabbit hole.
Discussioni
Domande frequenti
I prodotti disponibili tramite cTrader Store, inclusi bot di trading, indicatori e plugin, sono forniti da sviluppatori terzi e resi disponibili esclusivamente a scopo informativo e di accesso tecnico. cTrader Store non è un broker e non fornisce consulenze in materia di investimento, raccomandazioni individualizzate o garanzie di risultati futuri.


![Logo di "Gaussian Channel [Iridio Capital]"](https://cdn.ctrader.com/image/webp/7c039209-5573-4a54-a072-f9528b503103_41960)


Prezzo
Da 28/05/2025
69.61M
Volume negoziato
391.92K
Profitto in pip
2
Vendite