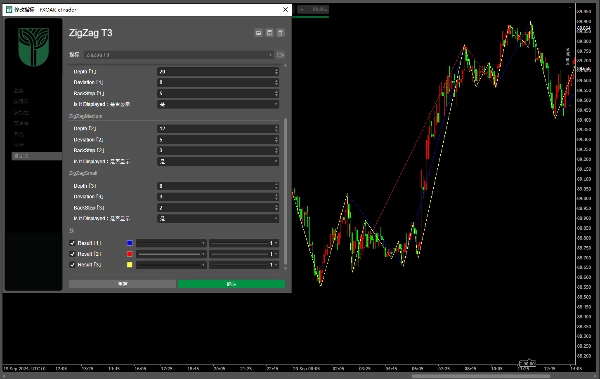
Indikator
VWAP
ZigZag
RSI
ATR
Fibonacci
Supertrend
MACD
Bollinger
ZigZag T3
Logo "ZigZag T3"
29/09/2025
40
Desktop
Since 11/09/2024
Jualan
3
Free installs
41
Imej yang dimuat naik "ZigZag T3"

Three ZigZag lines

Can close or open any one or more

Lebih banyak produk daripada penulis ini
Zigzag T3
Three ZigZag lines
zh-cn Variety Period clock panel(multilanguage)
This indicator can be used to: change color, shape size, position, change font, increase or decrease, and other function
RSI T3 overbought and oversold area
zh-cn Variety Period time panel(multilanguage)
This indicator can be used to: change color, shape size, position, change font, increase or decrease, and other function
RSI T3 Overbought and oversold areas
Three parameter RSI
Indikator
ZigZag
RSI
FVG
+4
Ten Thousand Functions Bands Cloud(First Edition)
A metric that can set 1 to 3 groups of Bollinger Bands
Anda juga mungkin suka
Indikator
Grid
RSI
Breakout
+18
Logarithmic Framework by LudwigICT
Drawing Utility
A rectangular box with 5 adjustable Fibonacci level or even custom ones.
calculateSpreads_withSourceCode
Indicator calculates spread in pips
Indikator
NAS100
NZDUSD
Breakout
+12
Samurai Breakout Pro II
⚔️Full breakout trading workstation: session box, EP/TP/SL levels, on-chart ✓/✗ outcomes, pro-level analytics and more⚔️
Auto Fibonacci Retracement
Auto Fibonacci Retracement Indicator for cTrader
AlgoCorner Market Sessions
Show each Market Session with full details, including grid mode for higher timeframes, statistics, and other metrics.
Indikator
Signal
Hammer Pattern Indicator
Indikator
Indices
RSI
Signal
[Stellar Strategies] MARSI Signal Plotter
🚀📈 Plot buy/sell signals on Range Bars using Moving Averages and RSI. Clear, actionable trading insights.🚀📈
Indikator
RSI
Commodities
Signal
+1
Dot Momentum %BB Indicator
Dynamic circles visualize price's volatility position. Like RSI for market overextension & stretch. Quantify context.
mIntrinsicRecursiveValue
Intrinsic Recursive Value Indicator
Indikator
RSI
XAUUSD
Breakout
+5
Dynamic Range MomentumI
This histogram helps visualize the strength and direction of market movements, making it easier to spot potential trends
Indikator
NAS100
NZDUSD
XAUUSD
+10
Tsunami Volume Surge - RVOL
🌊 Tsunami Volume Surge (RVOL) — Relative Volume Indicator for cTrader 🌊
FVG
The Indicator is a powerful tool for price-action traders seeking to identify and exploit short-term imbalances.
Indikator
NAS100
NZDUSD
XAUUSD
+14
Volume Profile Pivot Anchored
Anchor volume profiles to pivots with POC, VAH, VAL and real-time insights for clearer trade decisions.
ICT Killzones & Macros
KILLZONES AND MACRO SESSIONS
E7 Harmonic Structures Basic
E7 Harmonic Structures Basic.
Market_Session_Forex
Market Sessions
Indikator
RSI
Breakout
XAUUSD
+5
Channel Price Predictor
🔮Channel Price Predictor: Anticipates future price zones with trend channels based on volatility and projections." 📈