
Açıklama
Günlük Ortalama Fibonacci - Otomatik Günlük Fibonacci Seviyeleri
Günün açılışından itibaren Fibonacci seviyelerinde ortalama günlük aralığı projelendirir
Bu gösterge ne yapar?
Günlük Ortalama Fibonacci, ortalama günlük aralığa dayalı olarak otomatik Fibonacci seviyeleri çizer. Her gün, gösterge açılış fiyatından hem yukarı hem aşağı doğru önemli seviyeleri projelendirir ve potansiyel hedefleri ve dönüş bölgelerini belirlemenize yardımcı olur.
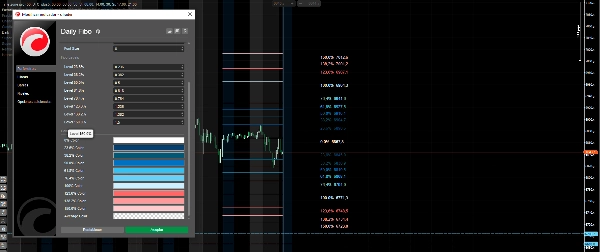
Ana Özellikler
✅ Otomatik günlük güncelleme - Seviyeler her gün otomatik olarak yeniden çizilir ✅ Özelleştirilebilir seviyeler - 8 farklı Fibonacci seviyesine kadar yapılandırma ✅ Özel renkler - Her seviyenin kendine özgü tanımlanabilir rengi vardır ✅ Fiyat etiketleri - Her seviyenin hem yüzdesini hem de tam fiyatını gösterir ✅ Ayarlanabilir gün ortalaması - Ortalama hesaplaması için kaç gün kullanılacağını seçin (varsayılan 20)
Varsayılan Dahil Edilen Seviyeler
- 0% - Günün açılışı (temel çizgi)
- 23.6%, 38.2%, 50%, 61.8%, 76.4% - İç geri çekilmeler ve genişlemeler
- 100% - Tam ortalama aralık
- 123.6%, 138.2%, 150% - Dış genişlemeler
Göstergenin Kullanımı
- Yönü belirleyin - Açılış fiyatı (0%) referans noktanızdır
- Boğa hedeflerini arayın - Üst seviyeler alım hedeflerini işaret eder
- Ayı hedeflerini arayın - Alt seviyeler satış hedeflerini işaret eder
- Dönüş bölgeleri - Fiyat aşırı seviyelere (100%+) ulaştığında olası dönüşleri arayın
Ayarlanabilir Parametreler
- Ortalama hesaplaması için gün sayısı
- Özel Fibonacci seviyeleri
- Seviye başına bireysel renkler
- Etiketleri ve fiyatları göster/gizle
- Yazı tipi boyutu
Ticaret oturumu sırasında net hedefler ve olası fiyat bölgeleri arayan tüccarlar için mükemmel.
Özet
Müşteri değerlendirmeleri
5 | 50 % | |
4 | 50 % | |
3 | 0 % | |
2 | 0 % | |
1 | 0 % |


