present
Sign up and get $50 off your first purchase
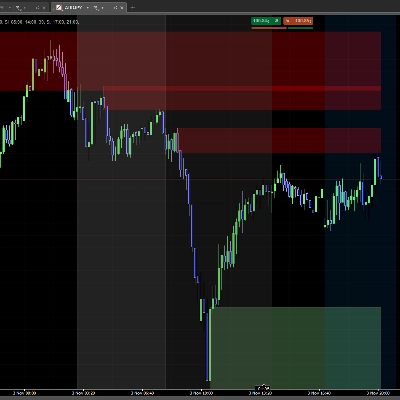
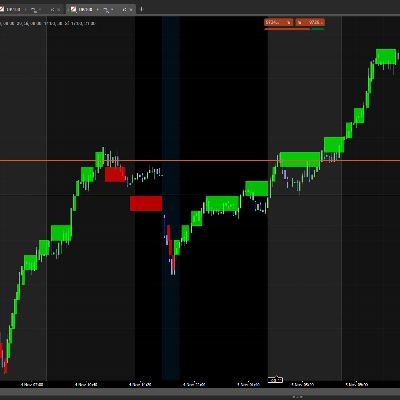
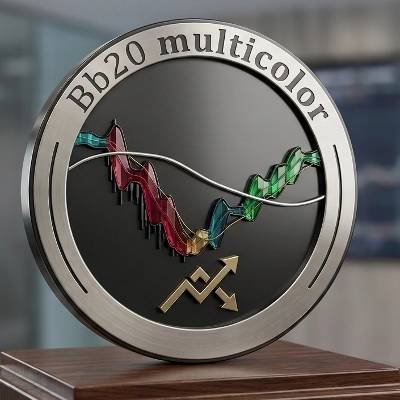
Trading product for Bb20 multicolor Indicator Signal Bollinger, image 1
Bb20 multicolor
Indicator
75 downloads
Version 1.0, Mar 2026
Windows, Mac
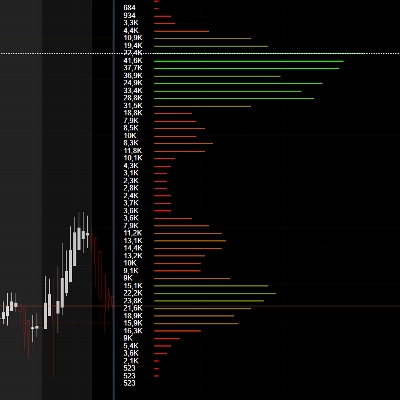
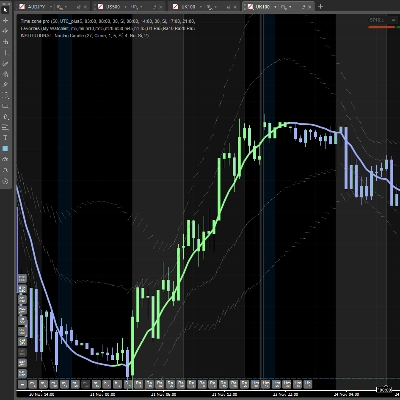
Trading product for Bb20 multicolor Indicator Signal Bollinger, image 2
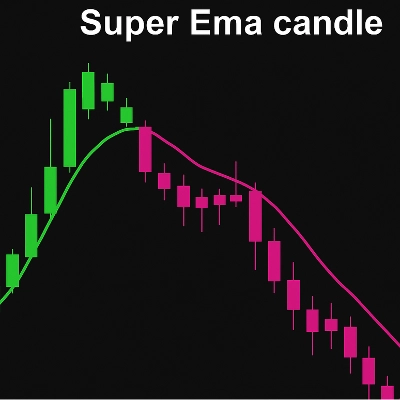
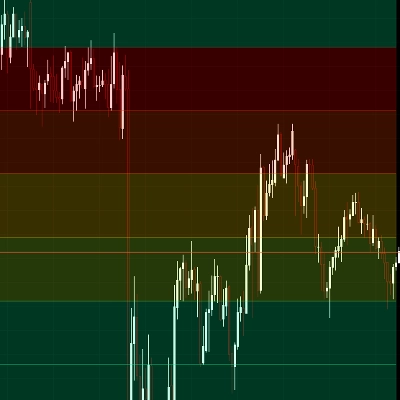
Trading product for Bb20 multicolor Indicator Signal Bollinger, image 3
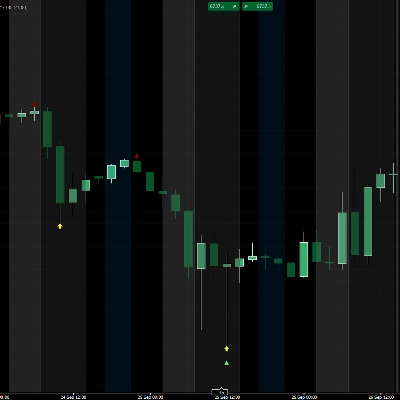
Trading product for Bb20 multicolor Indicator Signal Bollinger, image 4
Since 24/02/2025
18
Sales
2.14K
Free installs

Description

BB20 Multicolor


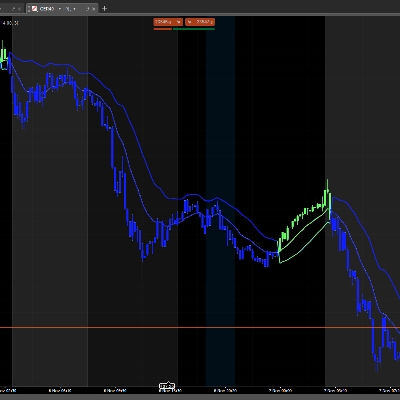
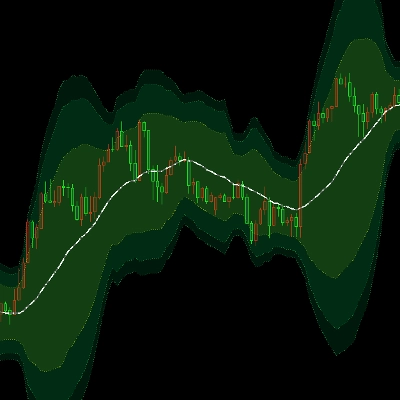
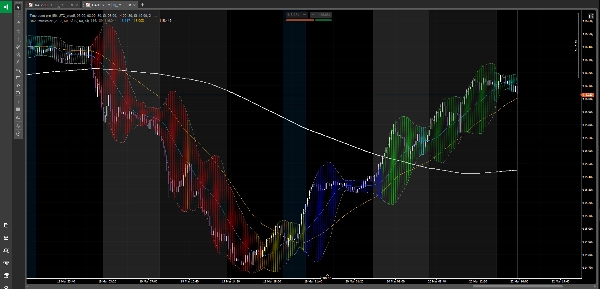
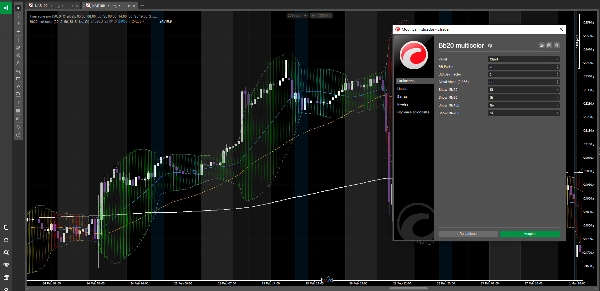
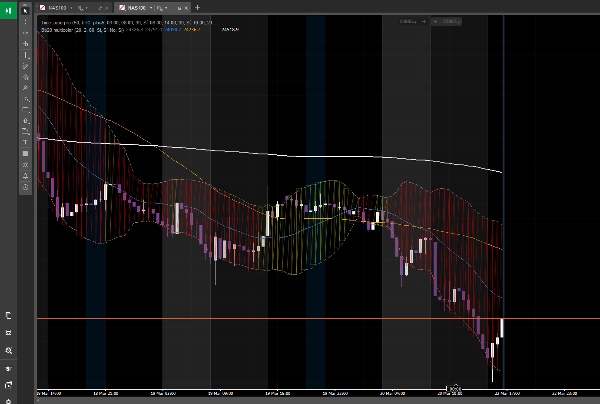
A powerful market cycle identification indicator that overlays directly on your chart, color-coding price action across 8 distinct market states β€” from deep bearish to fully bullish β€” using the relationship between price and four key moving averages (MM20, MM50, MM100, MM200) combined with Bollinger Bands.


──────────────────────────

HOW IT WORKS

──────────────────────────


The indicator constantly evaluates the position of price relative to the four moving averages and assigns one of 8 colors to the Bollinger Band cloud zone, giving you an instant visual read of the current market cycle stage:


πŸ”΄ RED β€” Clear bearish trend

Price is below MM200. The market is dominated by sellers. Bias: short only.


🟠 ORANGE β€” Technical bounce

Price is below MM200 but has recovered above MM20. A bounce within a bearish trend β€” not a reversal. Common bull trap zone.


🟑 YELLOW β€” Cycle phase 1

Price has crossed above MM50 but moving averages are still bearish. First signs of recovery, not yet confirmed.


πŸ”΅ BLUE β€” Trend reversal attempt

MM100 and MM50 are below MM200, but price is starting to climb between them. High volatility transition zone β€” watch closely.


⬜ GRAY β€” Neutral / weakening

Price is above MM200 but below MM100. The long-term structure is still bullish but momentum is fading. Caution zone.


🟒 LIME GREEN β€” Cycle phase 2

Price and MM50 are above MM200. A new bullish cycle is being confirmed. Many institutional traders begin positioning here.


πŸͺ΅ TEAL β€” Healthy consolidation

Price is above MM200 and MM100 but pulling back toward MM50 or MM20. A normal pause within a bullish trend β€” potential re-entry zone.


🌲 DARK GREEN β€” Mature bullish cycle

All moving averages fully aligned: MM200 < MM50 < MM20 < Price. Cleanest trending environment. Minimum resistance to the upside.


──────────────────────────

FEATURES

──────────────────────────


β€’ Cloud zones rendered natively with cTrader's Chart.DrawTriangle for smooth, professional-looking fills

β€’ Bollinger Bands (upper and lower) displayed alongside the cloud

β€’ All four moving averages individually toggleable (MM20, MM50, MM100, MM200)

β€’ Configurable BB period, standard deviation factor, and cloud transparency

β€’ Works on any instrument and any timeframe

β€’ Fully open source β€” free forever


──────────────────────────

HOW TO USE IT

──────────────────────────


1. Use the color as a market context filter before taking any trade

2. Only look for longs when the background is green (lime or dark)

3. Only look for shorts when the background is red or orange

4. Use yellow, blue, and gray as transition zones β€” reduce size or wait for confirmation

5. Teal is your re-entry zone in an established bullish trend


Compatible with any trading strategy. Particularly effective when combined with price action, volume analysis, or sentiment-based approaches.


Install it, drop it on your chart, and instantly know what phase the market is in.

⚠️ RISK DISCLAIMER


Trading financial instruments involves risk and is not suitable for everyone. Always do your own analysis, manage your risk carefully, and never trade with money you cannot afford to lose.


This indicator is a technical analysis tool β€” not financial advice. Use it wisely.

Summary

AI summary
Bb20 Multicolor is a technical indicator designed to identify market cycles by color-coding price action into eight distinct states, ranging from deep bearish to fully bullish. It overlays directly on the chart, using the relationship between price, four moving averages (MM20, MM50, MM100, MM200), and Bollinger Bands to determine the market phase. The indicator assigns colors to a Bollinger Band cloud zone to visually represent market conditions:

- Red: Clear bearish trend (price below MM200)
- Orange: Technical bounce within bearish trend
- Yellow: Early recovery signs (price above MM50, but MAs bearish)
- Blue: Trend reversal attempt with high volatility
- Gray: Neutral or weakening momentum (price above MM200 but below MM100)
- Lime Green: Confirmed new bullish cycle (price and MM50 above MM200)
- Teal: Healthy consolidation in bullish trend (price above MM200 and MM100, pulling back)
- Dark Green: Mature bullish cycle with aligned moving averages

Features include native cloud rendering using cTrader's Chart.DrawTriangle, toggleable moving averages, configurable Bollinger Bands parameters, and compatibility with any instrument and timeframe. The indicator is open source and free to use. It serves as a market context filter to guide trade decisions, recommending long positions in green zones and shorts in red/orange zones, with caution advised in transition colors. It complements various trading strategies, including price action and volume analysis.
Indicator profile

Customer reviews

0.0
Reviews: 0
Customer reviews
No reviews for this product yet. Already tried it? Be the first to tell others!

Discussion

FAQ
Signal
Bollinger
Products available through cTrader Store, including trading bots, indicators and plugins, are provided by third-party developers and made available for informational and technical access purposes only. cTrader Store is not a broker and does not provide investment advice, personal recommendations or any guarantee of future performance.

More from this author

Indicator
Forex
Crypto
+1
Order block
Indicator
Forex
NAS100
+3
volumen perfile
Indicator
Forex
Crypto
+3
FREE Global Trading Sessions Indicator
Indicator
Forex
Crypto
+2
PREMIUN INDICATOR
Indicator
Forex
Crypto
+1
Super Arrows
Indicator
Forex
Crypto
+3
Perfect Trend
Indicator
Forex
Crypto
+2
Daily Fibo
Indicator
Forex
Crypto
+5
ICT Order Block Advanced
Desktop plugin
Trade Alerts
Quick Switch Toolbar
Indicator
Forex
Crypto
+2
HTF Candle
Indicator
Forex
Crypto
+3
INSTITUTIONAL Nonlag Candle
"Heatmap" logo
Top-rated
4.5
(4)
$25
Indicator
Forex
XAUUSD
+1
heatmap

You may also like

Indicator
SMC
Forex
+5
The only cTrader FVG indicator with Breakaway Gap detection, mitigation tracking, and full multi-asset compatibility.
Indicator
AI
RSI
+7
EMA MTF TREND PRO - Multi-timeframe trend analysis overlay indicator, 6 timeframes - in one table with ADX
Indicator
BOS
MSS
+5
Your entire ICT session map, structure engine, and key levels β€” No manual work. One indicator. Every session!
Indicator
ATR
BOS
+4
Based on market structure and draws liquidity zones, institutional flows, and consolidation ranges. Smart Money Concepts
Indicator
Key Levels
Order Block
+5
Order blocks, fair value gaps, liquidity sweeps and a 24-timeframe signal scanner on one chart.
Indicator
Forex
cTrader Auto Support & Resistance detects key levels with Fibonacci analysis and sends real-time trading alerts.
Indicator
ATR
RSI
+6
Market structural patterns , specifically the concepts of Change of Character (ChoCH) πŸ”„ and Break of Structure (BoS) πŸ’₯
Indicator
Prop
Forex
+11
🌊 See when the market is truly in play. Tsunami measures Relative Volume by time-of-day 🌊
Indicator
ATR
RSI
+4
Adaptive Ichimoku with nine-factor confluence scoring, five signal types, smart TP/SL and an MTF panel.
Indicator
ATR
RSI
+1
Super Trend Rsi ,ATR + trend change distance + dynamic Alpha, divergence/convergence
Indicator
ATR
RSI
+14
A metric that can set 1 to 3 groups of Bollinger Bands
Indicator
A function demo version of VWAP indicator with std. dev. bands. Expired on 1st Aug, 2025.
Indicator
ATR
BOS
+5
Know how strong each Supertrend flip is: scored BUY/SELL, structure stop + 3 targets, live win-rate dashboard, alerts.
Indicator
Prop
Forex
+14
Smart money liquidity sweep detector at fractal levels. 100% free - no limitations.
Indicator
ZigZag Pro – Multi-Swing Indicator for cTrader Description: ZigZag Pro is a powerful and fully customizable swing indica
Indicator
ATR
Breakout
+1
A volatility-adaptive trend-following indicator that dynamically adjusts to market conditions.
Indicator
Order Block
Breaker Block
+5
Unicorn Model ICT Indicator β€” Smart Trading with Precision
Indicator
It draws a step line that visualize the movement of H4. Particularly effective when trade on lower timeframe.

Price

Since 24/02/2025
18
Sales
2.14K
Free installs