
Açıklama
Çekirdek ağırlıklı regresyon matematiği kullanarak uyarlanabilir trend analizi.
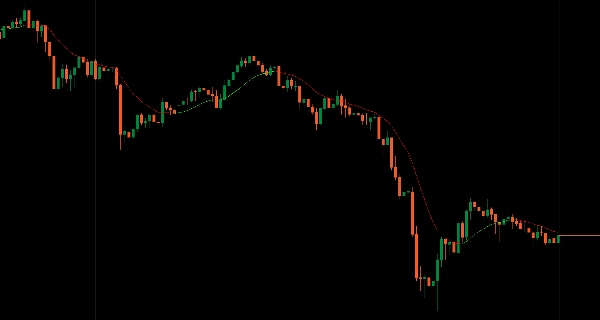
Yakındaki çubukların daha fazla etkilediği ve uzak çubukların üssel olarak solduğu Gaussian çekirdek ağırlıklandırmasını uygular, sabit dönem gecikmesi olmadan ultra pürüzsüz trend çizgileri oluşturur.
Yerel fiyat yapısına otomatik uyum, geleneksel hareketli ortalamalara kıyasla minimum gecikme, dinamik renk kodlaması (Limon yeşili yükselen trend, Kırmızı düşen trend), yanıt verme ayarı için ayarlanabilir bant genişliği, esnek geriye dönük pencere (50-2000 çubuk) ve iki renkli gürültüsüz tasarım, keyfi dönem seçimi olmadan uyarlanabilir yumuşatma arayan tüccarlar için matematiksel olarak hassas trend tanımlaması sağlar.
ÖZELLİKLER
Çekirdek Ağırlıklı Hesaplama
- Yakındaki çubuklar daha fazla etkiler, uzak çubuklar üssel olarak solar—keyfi sabit dönem yoktur
- Matematiksel olarak optimal yumuşatma için Gaussian çekirdek ağırlıklandırması
- Manuel yeniden kalibrasyon olmadan yerel fiyat yapısına otomatik uyum sağlar
- Minimum gecikme: Eşdeğer hareketli ortalamalardan daha hızlı gerçek trend değişikliklerine yanıt verir
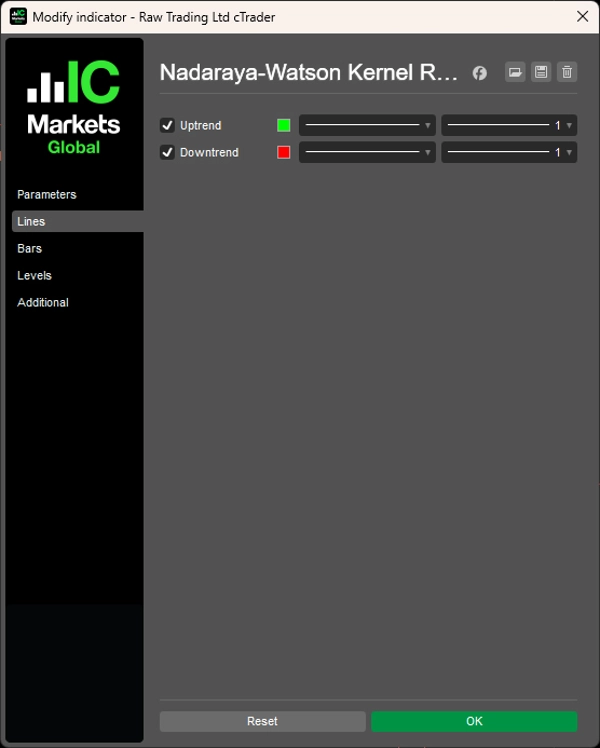
Dinamik Renk Kodlaması
- Limon yeşili: Yükselen trend
- Kırmızı: Düşen trend
- Trend yönünün anlık görsel onayı
- Kesintili çizgi gösterimi: Renk değişimleri anlık ve görsel olarak nettir
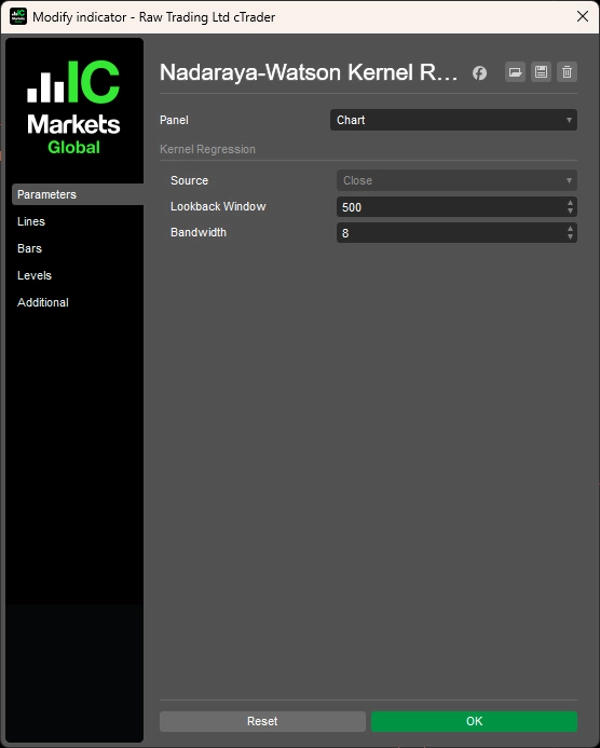
Ayarlanabilir Parametreler
- Bant genişliği: Yanıt verme ile yumuşaklık arasında ince ayar yapma
- Esnek geriye dönük pencere: Zaman diliminize uyacak şekilde 50-2000 çubuk
- Farklı piyasa koşullarına ve ticaret stillerine uyum sağlar
Temiz Tasarım
- İki renk, sıfır karmaşa—ya yükselen ya da düşen trend
- Gürültüsüz trend tanımlaması
- Karmaşık ayarlar gerekmez
- Matematiksel hassasiyetle görsel sadelik
__________________________________________________________________________________________
DAHA FAZLA ÜCRETSİZ GÖSTERGE
Yapı ve hacimden regresyon, volatilite ve özel zaman dilimlerine kadar geniş bir piyasa analiz araçları yelpazesini keşfedin.
Kaynak kodu GitHub deposunda mevcuttur.
Kullanımı tamamen ücretsizdir. Ancak kahve desteği göndermek isterseniz, bunu buradan yapabilirsiniz.
Destek/Direnç
Hacim
- Hacim Aktivite Profili
- Hacim Verimlilik Analizörü
- Hacim Profili Analitiği
- Hacim Profili - Güncellenmiş
- Hacim Yayılım Analizi
- VWAP (Hacim Ağırlıklı Ortalama Fiyat)
Hareketli Ortalamalar
- SSL Kanalı
- Çapa Hareketli Ortalama
- Sapma Ölçekli Hareketli Ortalama
- Gann Yüksek Düşük Aktivatörü
- Anlık Trend Çizgisi
- Trend Vizyonlu Kaufman Uyarlanabilir MA
- Hareketli Ortalama Kanalı
- Hareketli Ortalamalar Paketi
- Trend Kanalı Hareketli Ortalama
Araçlar/Özel
Regresyon Tabanlı
Volatilite
Osilatörler
__________________________________________________________________________________________
FERAGATNAME
Ticaret risk içerir. Bu gösterge yalnızca teknik analiz amaçlıdır — her zaman uygun risk yönetimi uygulayın ve sorumlu şekilde işlem yapın.
GERİ BİLDİRİM & GELİŞTİRMELER
Önerileriniz, özellik talepleriniz veya geliştirme fikirleriniz varsa, lütfen Tartışma sekmesinde bir yorum bırakın. Geri bildiriminiz göstergenin herkes için geliştirilmesine yardımcı olur.
Özet
Key features include dynamic color coding with lime indicating uptrends and red indicating downtrends, offering instant visual confirmation of trend direction through a noise-free, two-color design. Users can fine-tune the indicator’s responsiveness and smoothness via adjustable bandwidth and select a flexible lookback window ranging from 50 to 2000 bars to suit various timeframes and market conditions.
The indicator emphasizes mathematical precision and visual simplicity, requiring no complex settings. It is designed for traders seeking an adaptive smoothing method for trend identification without arbitrary period selection. This tool supports scalping strategies and is part of a broader suite of market analysis indicators focused on regression, volume, volatility, and custom timeframes.
Müşteri değerlendirmeleri
5 | 100 % | |
4 | 0 % | |
3 | 0 % | |
2 | 0 % | |
1 | 0 % |


